2 March, 2019
Welcome to AmiBrokerAcademy.com. We provide US stock analysis for academy learning.
Think!
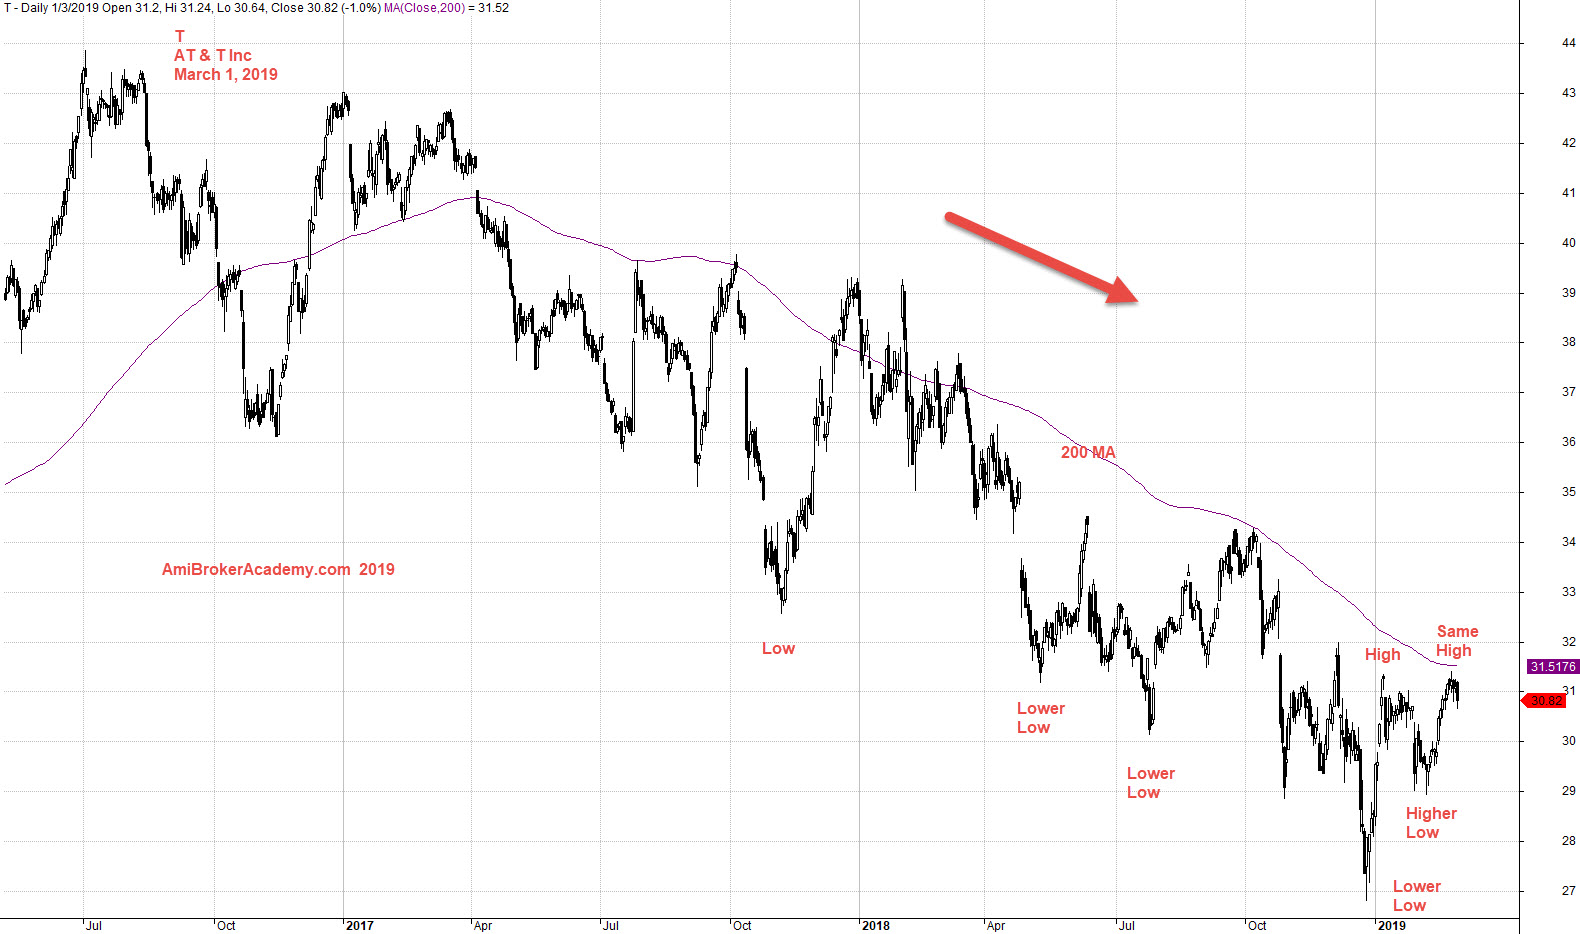
AT&T Inc Stock Charting
Study AT&T Inc stock chart.
As said, when you can see the when to buy or sell in a fast MA. Focus on the Slow MA.
But, this more for the longer term trader.
Remember, the entry for such price action is the first determine the trend, make your trade plan.
For a bear trend for the current example, AT & T stock charting. You may want to sell than buy. Why? Because you can be more sure when the price action is near the MA, and has a lower risk if the trend decide to change direction.
You could you additional indicator, such as MACD indicator to provide another confirmation on the entry. See the next posting.
Think!
But think think got more Things!
Trade with your eyes open.
Moses Stock Observation
AmiBrokerAcademy.com
Disclaimer
The above result is for illustration purpose. It is not meant to be used for buy or sell decision. We do not recommend any particular stocks. If particular stocks of such are mentioned, they are meant as demonstration of Amibroker as a powerful charting software and MACD. Amibroker can program to scan the stocks for buy and sell signals.
These are script generated signals. Not all scan results are shown here. The MACD signal should use with price action. Users must understand what MACD and price action are all about before using them. If necessary you should attend a course to learn more on Technical Analysis (TA) and Moving Average Convergence Divergence, MACD.
Once again, the website does not guarantee any results or investment return based on the information and instruction you have read here. It should be used as learning aids only and if you decide to trade real money, all trading decision should be your own.