11 December, 2019
Welcome to AmiBrokerAcademy.com. Thanks for visiting the site.
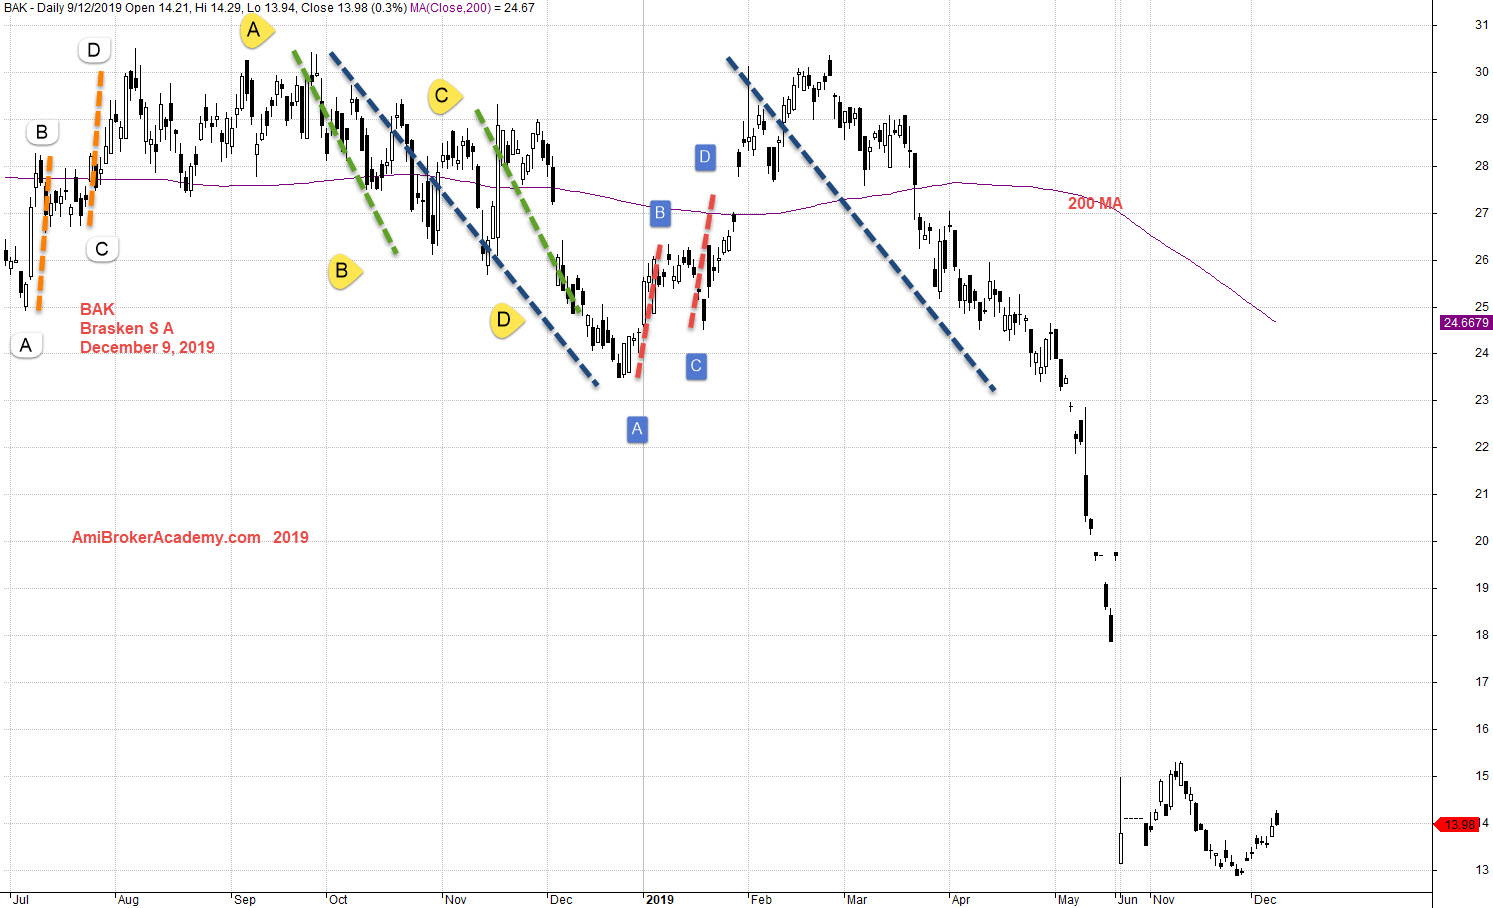
BAK Braken SA Stock Charting
Study Brasken S A stock chart and price action and 200 moving average.
Look left and think right. Manage your expectation.
See chart, picture worth a thousand words.
Moving Average is a great visual trend tool, see 200 MA. MA from flat to slopping down.
Price Action has a sharp fall, and rebounce up. This is dead cat bounce.
Price Action pull back but fail again. Only thing is the price action only go slight lower than the last low. If the buy up is not strong enough the price action can fail further. Be aware.
H M Gartley is a great price action tool, see the ABCD Patterns marked on chart.
Trade with eyes open.
Moses Stock Observation
AmiBrokerAcademy.com
Disclaimer
The above result is for illustration purpose. It is not meant to be used for buy or sell decision. We do not recommend any particular stocks. If particular stocks of such are mentioned, they are meant as demonstration of Amibroker as a powerful charting software and MACD. Amibroker can program to scan the stocks for buy and sell signals.
These are script generated signals. Not all scan results are shown here. The MACD signal should use with price action. Users must understand what MACD and price action are all about before using them. If necessary you should attend a course to learn more on Technical Analysis (TA) and Moving Average Convergence Divergence, MACD.
Once again, the website does not guarantee any results or investment return based on the information and instruction you have read here. It should be used as learning aids only and if you decide to trade real money, all trading decision should be your own.