30 July 2021
Welcome!
Welcome to AmiBroker Academy dot com, amibrokeracademy.com.
We sometime bench mark two stock price action or stock price with index, but this time we benchmark three stocks. The following example, we benchmark three local banks, DBS, OCBC and UOB. They are the local financial key players. Besides correlation we use other tools such as 1) Ichimoku Cloud, 2) Support Resistance (using box), 3) River (moving average), 4) GMMA and Woodies CCI, 5) Bollinger Bands and Moving Averages, and 6) MACD to analyze chart. See our simple reading of price action.
We also apply wave theory onto chart. Such as well know Elliott Waves. Just in case you are not familiar with Elliott Waves. Elliott was from Ralph Nelson Elliott.
Otherwise, we like to use pattern, such as ABCD pattern. Checkout our posting here for more.
We translate price action chart into layman language. This will help you in understand the financial instrument you are trading. We believe picture worth a thousand words. So, sometimes we use less words. You can learn the price action interpretation too. Give it a tray. You may not have the same view points as us. Remember all analysis read price action chart differently. It is just like reading an essay, we will have different conclusion.
Trade what you see. Manage your risk. Trade well.
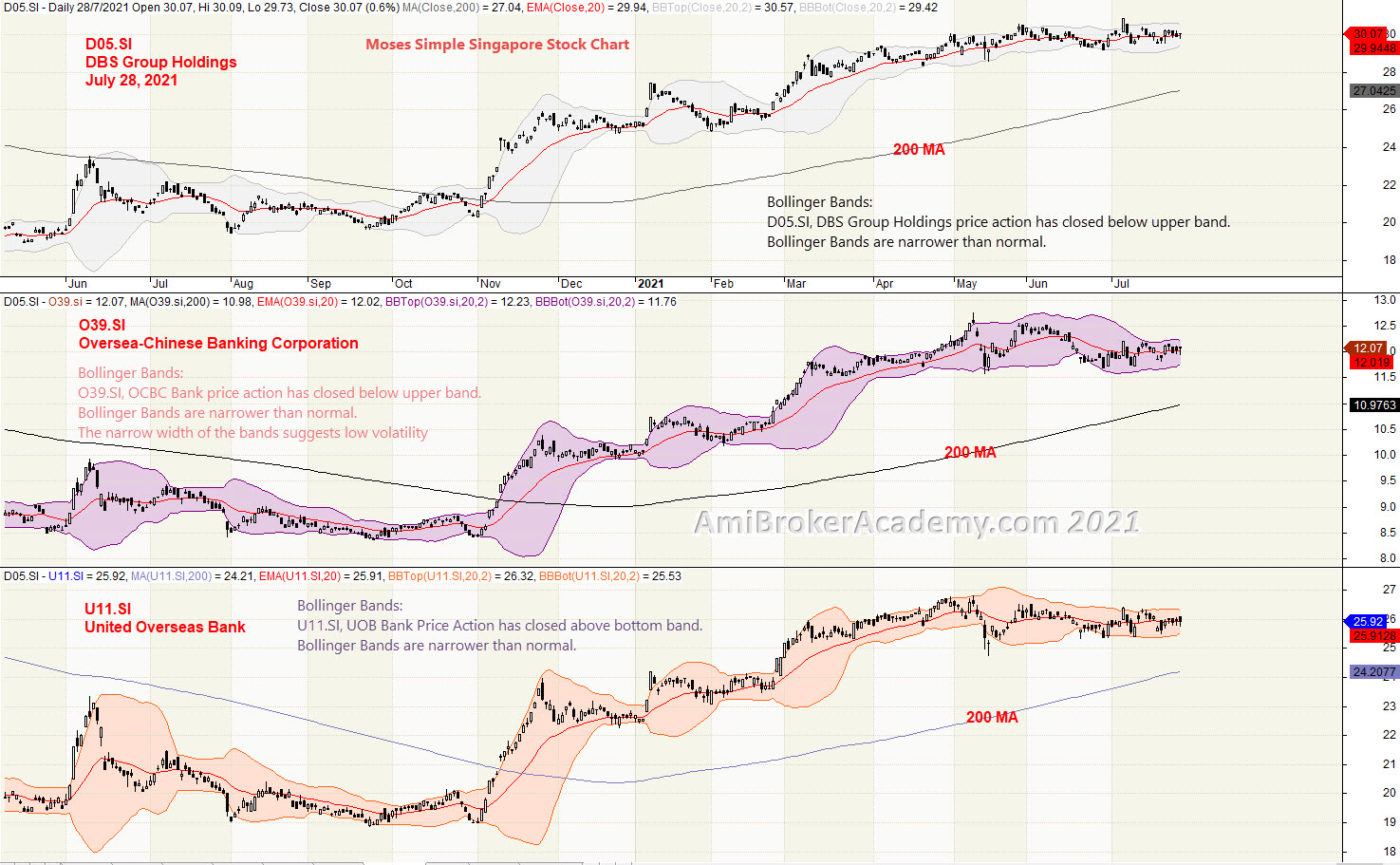
1) DBS Bank and OCBC Bank and UOB Bank Correlation
Most of the time, we benchmark two stocks. This time, we decided to benchmark three, three local bank stocks. They are DBS, OCBC and UOB. These are the three major local banks.
DBS price has continue to go higher, from bottom left to top right. In fact, this is true for the other two banks too. Price Action goes from bottom to top. The only different are different degree of high. Remember we are not talking about the dollar value. The stock price for the three banks are different.
A simple observation is the bollinger bands are narrow. So, the volatility is reduce at this moment. On the other hand, the price action can breakout and become volatile anytime. Trade with eyes open.
Remember, we just read what the chart said. Have fun!
Moses Power Charting
Official AmiBrokerAcademy.com Charting
Disclaimer
The above result is for illustration purpose. It is not meant to be used for buy or sell decision. We do not recommend any particular stocks. If particular stocks of such are mentioned, they are meant as demonstration of Amibroker as a powerful charting software and MACD. Amibroker can program to scan the stocks for buy and sell signals.
These are script generated signals. Not all scan results are shown here. The MACD signal should use with price action. Users must understand what MACD and price action are all about before using them. If necessary you should attend a course to learn more on Technical Analysis (TA) and Moving Average Convergence Divergence, MACD.
Once again, the website does not guarantee any results or investment return based on the information and instruction you have read here. It should be used as learning aids only and if you decide to trade real money, all trading decision should be your own.
We learn from many past and present great traders. Kudo to these master.