April 14, 2019
Welcome to AmiBrokerAcademy.com. Thanks for visiting the site.
We interpreting the markets emotion, price action using patterns and indicators. Hope this make sense to you. Have fun!
This is a stock to watch. Have fun!
MSFT Microsoft Corporation Stock Charting
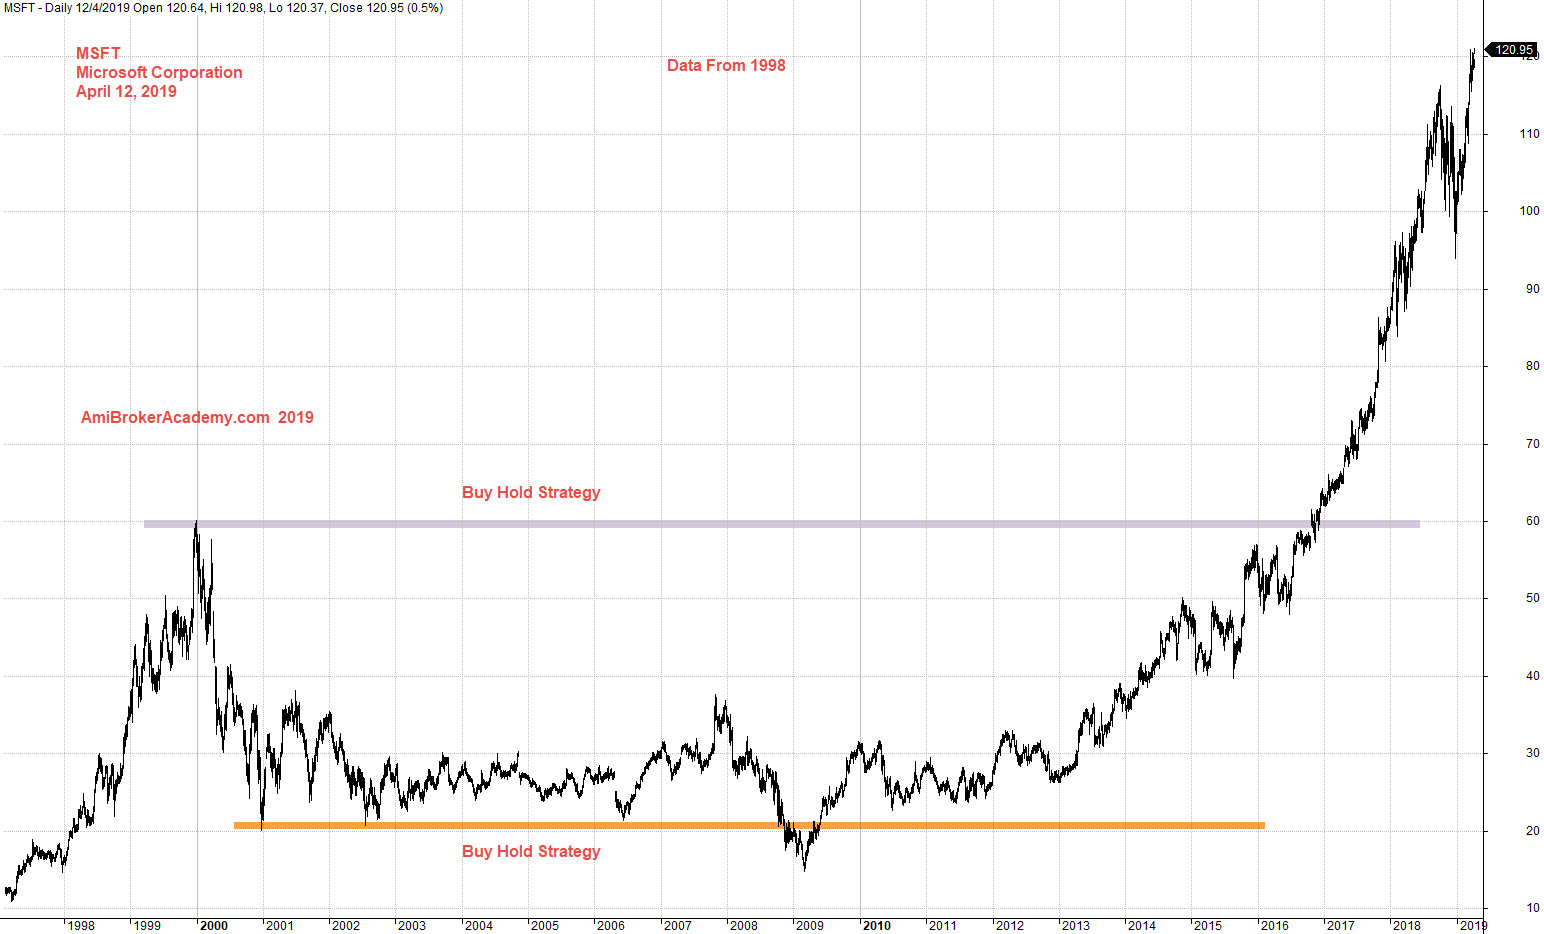
Study Microsoft Corporation Stock chart from 1998.
See chart, picture worth a thousand words.
If you are a Buy Hold Strategist, and this is one of your portfolio. You probably very unhappy. Why? The chart says it all.
Experience traders has to be flexible in any strategy. Or put it in other way, for professional, they cut lost fast.
For the same data, and hints from any sources. Some may complaint and claim that is fake news. But it is all to do with timing.
Trade with your eyes open.
Moses Stock Observation
Moses Stock Analysis
AmiBrokerAcademy.com
Disclaimer
Disclaimer
The above result is for illustration purpose. It is not meant to be used for buy or sell decision. We do not recommend any particular stocks. If particular stocks of such are mentioned, they are meant as demonstration of Amibroker as a powerful charting software and MACD. Amibroker can program to scan the stocks for buy and sell signals.
These are script generated signals. Not all scan results are shown here. The MACD signal should use with price action. Users must understand what MACD and price action are all about before using them. If necessary you should attend a course to learn more on Technical Analysis (TA) and Moving Average Convergence Divergence, MACD.
Once again, the website does not guarantee any results or investment return based on the information and instruction you have read here. It should be used as learning aids only and if you decide to trade real money, all trading decision should be your own.