August 23, 2017
If you find that you have troubles understand the fundamental, just study the chart. By looking at the chart, depending what you see. …
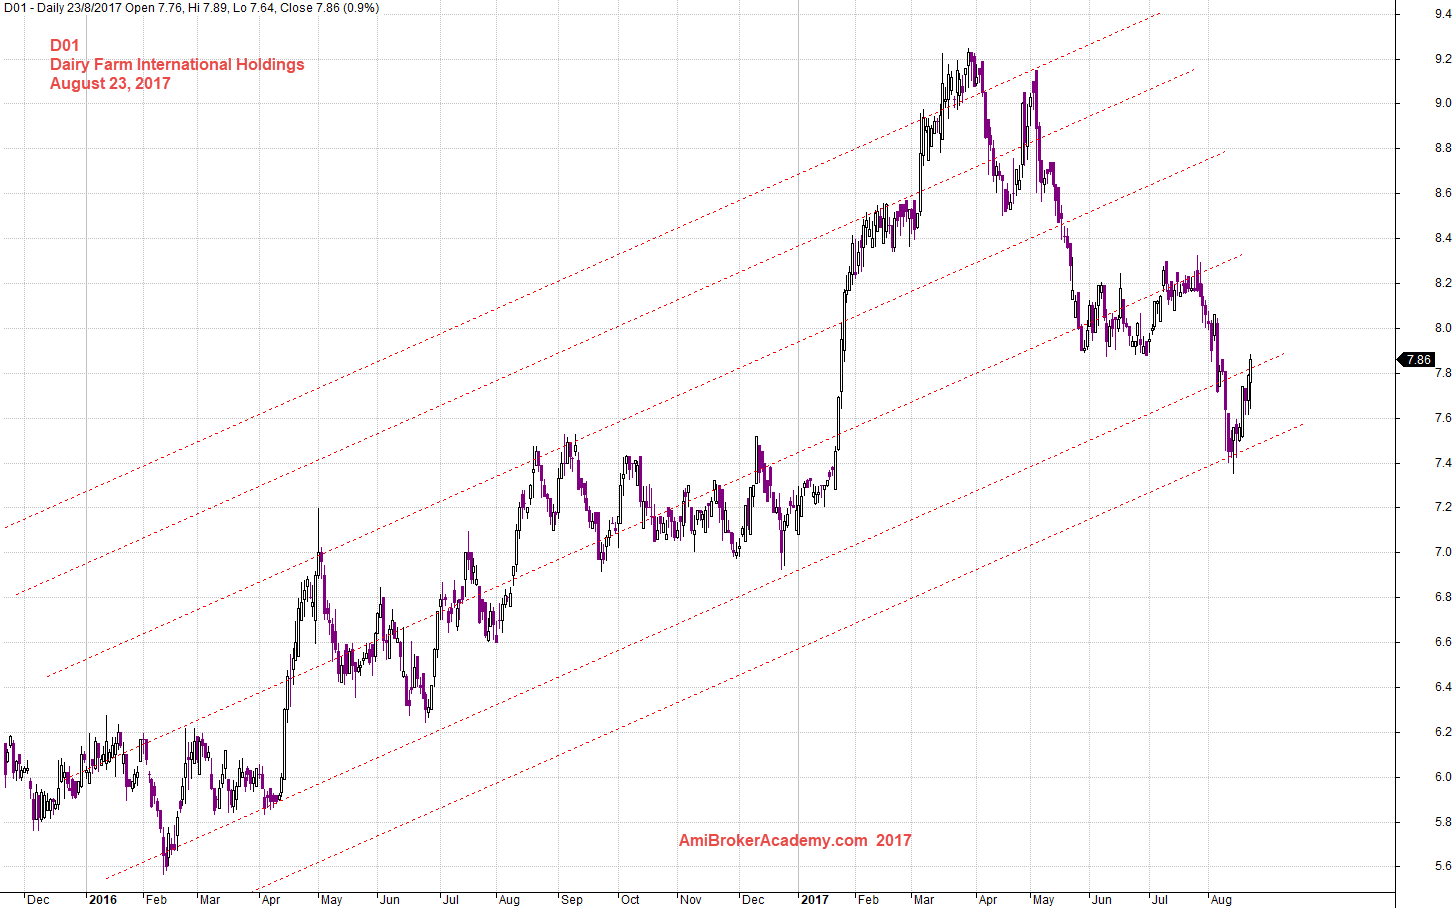
D01 Dairy Farm International Holdings and Channel
Picture worth a thousand words. Share price moving zigzag. The share price reach the high of $9.2 than the price action starts to keep forming lower high and lower low.
Connecting the low and draw a trendline. Copy and paste the trend line on the major top, and forms the channel. See the stock price after touch the upper band of the channel of the biggest channel and it starts to drift south. Now the share price has reached the other end, lower band of the channel.
The price action is bouncing up and travel north. Keep an eye on the share price. You can buy after the share price pullback and get supported. But, all setup can fail. So, trade responsibly.
August 23, 2017 Daily Farm International Holdings
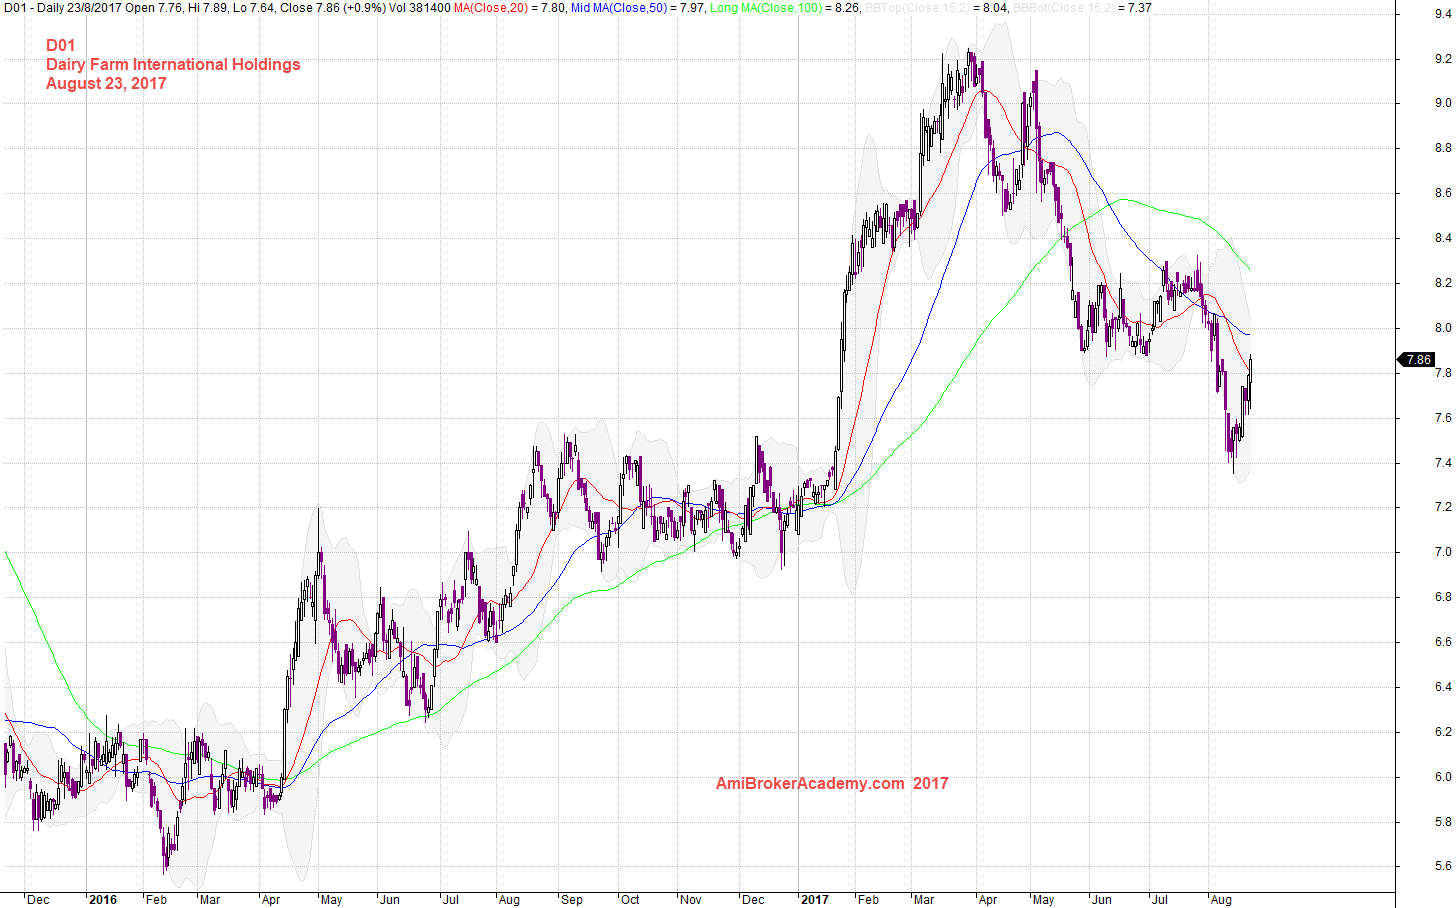
D01 Dairy Farm International Holdings and Moving Averages
Picture worth a thousand words. $7.80 is the resisted by the 20 MA. $7.9 was the previous support. Support has turns resistance.
We see dead cross of 20 MA crosses below 50 MA. And We see the golden cross fail, ie 20 MA try to cross back up 50 MA. But all in all, we see 50 MA slopping from top to bottom, bearish. Besides that we see price action are bouncing below MA.
So, unless you are sure, buy is a contertred trade. Be care.
August 23, 2017 Daily Farm International Holdings and MAs
Thanks for visit the site here. You could also find free MACD scan here in this site too.
Moses
AmiBrokerAcademy.com
Disclaimer
The above result is for illustration purpose. It is not meant to be used for buy or sell decision. We do not recommend any particular stocks. If particular stocks of such are mentioned, they are meant as demonstration of Amibroker as a powerful charting software and MACD. Amibroker can program to scan the stocks for buy and sell signals.
These are script generated signals. Not all scan results are shown here. The MACD signal should use with price action. Users must understand what MACD and price action are all about before using them. If necessary you should attend a course to learn more on Technical Analysis (TA) and Moving Average Convergence Divergence, MACD.
Once again, the website does not guarantee any results or investment return based on the information and instruction you have read here. It should be used as learning aids only and if you decide to trade real money, all trading decision should be your own.