April 8, 2017
Welcome to Moses’s Singapore Stock Analysis @ AmiBrokerAcademy.com.
D05 DBS Group Holdings Charting
Study the chart, you see the price formed higher low, on it way to uptrend. But, when the lower level of channel can not support the price and breakout. Be ready to wait the the price to form higher low again.
So, from left to right, you see the first channel, the second channel, the third and so on.
Remember, why the price continue to go higher is because all traders think the price is still cheap. And why the price start to fail and goes lower, because the traders think the price is too high and stop buying.
So, the price continue to move high and low.
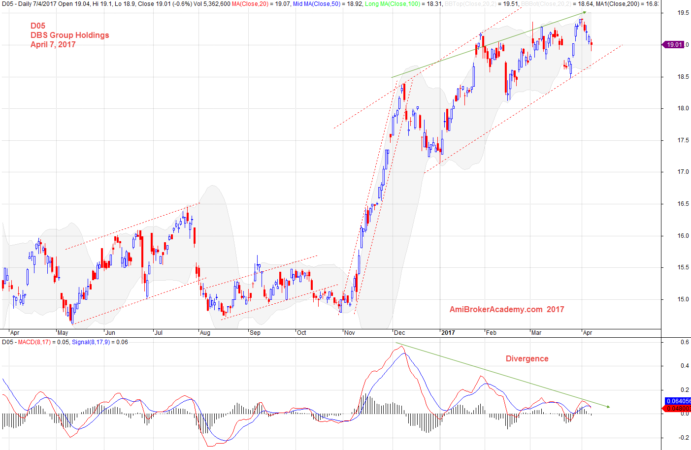
April 7, 2017 DBS Group Holdings and Channel
Moses
AmiBrokerAcademy.com
Disclaimer
The above result is for illustration purpose. It is not meant to be used for buy or sell decision. We do not recommend any particular stocks. If particular stocks of such are mentioned, they are meant as demonstration of Amibroker as a powerful charting software and MACD. Amibroker can program to scan the stocks for buy and sell signals.
These are script generated signals. Not all scan results are shown here. The MACD signal should use with price action. Users must understand what MACD and price action are all about before using them. If necessary you should attend a course to learn more on Technical Analysis (TA) and Moving Average Convergence Divergence, MACD.
Once again, the website does not guarantee any results or investment return based on the information and instruction you have read here. It should be used as learning aids only and if you decide to trade real money, all trading decision should be your own.