May 9, 2018
Thanks for visiting the site, AmiBrokerAcademy.com.
Let’s study the T-Mobile USA stock chart again.
US Stock Analysis – Chart Stories
T-Mobile USA and Support Resistance
Study T-Mobile USA stock price using Support Resistance. Let examine the stock price action using the monthly high low, or monthly support resistance. We see the stock price bullish in the early part of 2017, as you can see the resistance level kept raising. Thereafter the price action begin to form lower high and lower low. See chart the lower is even lower than the start of 2017 low. T-Mobile stock price rebounce, but the high can not go any higher than the 2017 high, only match the second high. Now the price test again the low. See chart, picture worth a thousand words. Manage your risk.
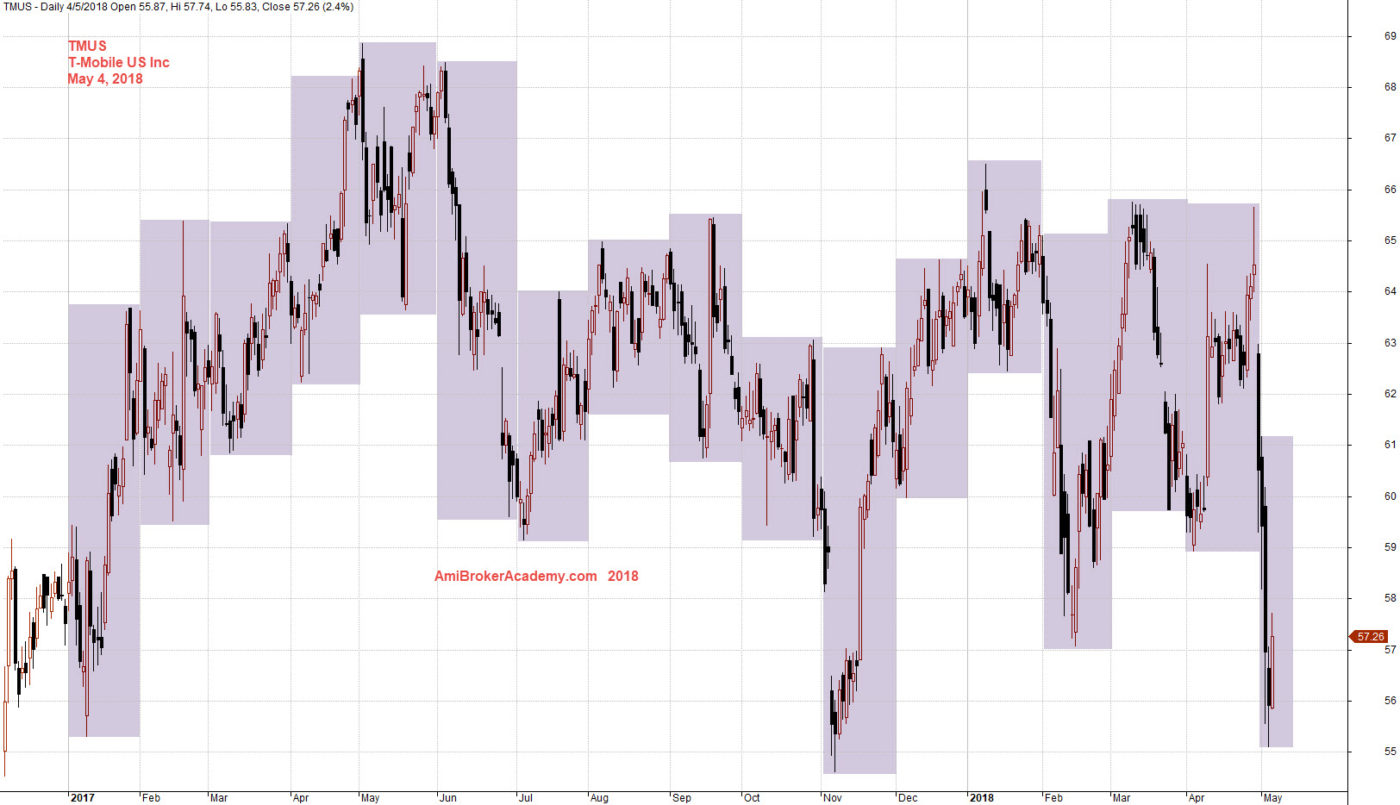
May 4, 2018 T-Mobile US Inc and Support Resistance
T-Mobile USA and MACD
See chart for more, the MACD is showing bearish bias. Both MACD-H and MACD is below zeroline. Manage your risk.
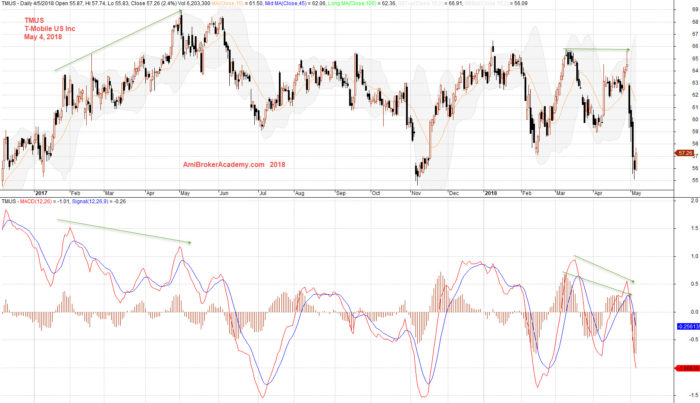
May 4, 2018 T-Mobile US Inc and MACD
Moses Stock Analysis
AmiBrokerAcademy.com
Disclaimer: All information, data and material contained, presented, or provided on amibrokeracademy.com is for educational purposes only. It is not to be construed or intended as providing trading or legal advice. Decisions you make about your trading or investment are important to you and your family, therefore should be made in consultation with a competent financial advisor or professional. We are not financial advisor and do not claim to be. Any views expressed here-in are not necessarily those held by amibrokeracademy.com. You are responsible for your trade decision and wealth being.