May 9, 2018
Anyone can recall, the last time we look at Verizon Communication Inc was in 2016, October 2016. A long long time ago.
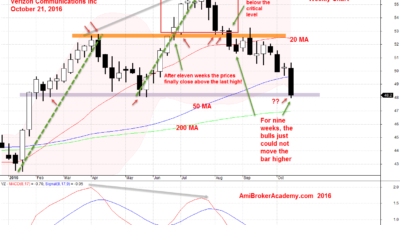
October 21, 2016 Verizon Communication Weekly
We study VZ Weekly Chart. See chart for more.
Thanks for visiting the site, AmiBrokerAcademy.com.
Let’s study VZ Verizon Communications Inc stock chart again.
US Stock Analysis – Chart Stories
Verizon Communications Inc and MA Wave
Study Verizon Communications Inc stock price using Moving Average, instead of just one MA, one MA with different period. Let try use the same period such as 34, and apply the high, low and close. In this case the three MAs become a band, we call the band wave, or river. See chart, picture worth a thousand words. The price action zip up zip down the MA band. From the start of 2017, the price action zip down the MA and stay below until August. Then the price action begin to cross up the river, the MA band, and stay above. But this does not last, in 2018, the price action start to fall below the MA band, and stay below. The MA band is slopping down too. Only until April, the price action try to fight back to close above MA, but again fail. Can the stock price finally close above MA wave. Will see. Manage your risk.
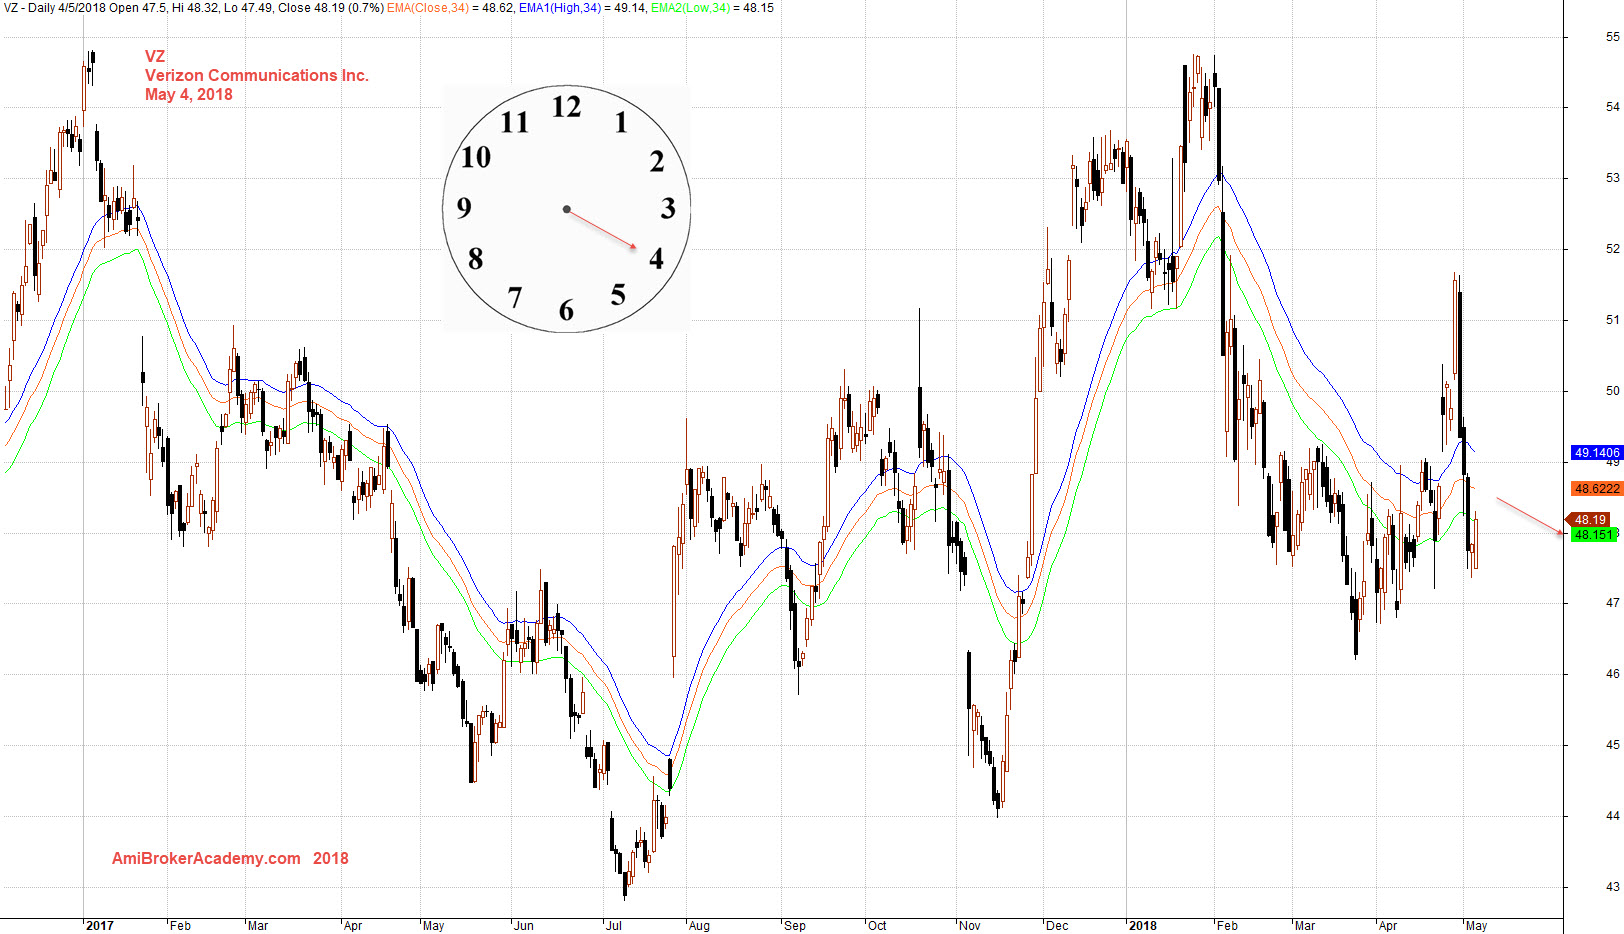
May 4, 2018 Verizon Communications Inc and MA Wave
VZ Verizon Communications Inc and Support Resistance
Picture worth a thousand words, see chart. We use the month high low, or month support resistance to determine the stock trend. We see the stock price keep forming higher resistance, see chart. But at the same time the support also keep going lower too, see the two trendlines. The price action are wide open. The stock price is very volatile. Manage your risk.
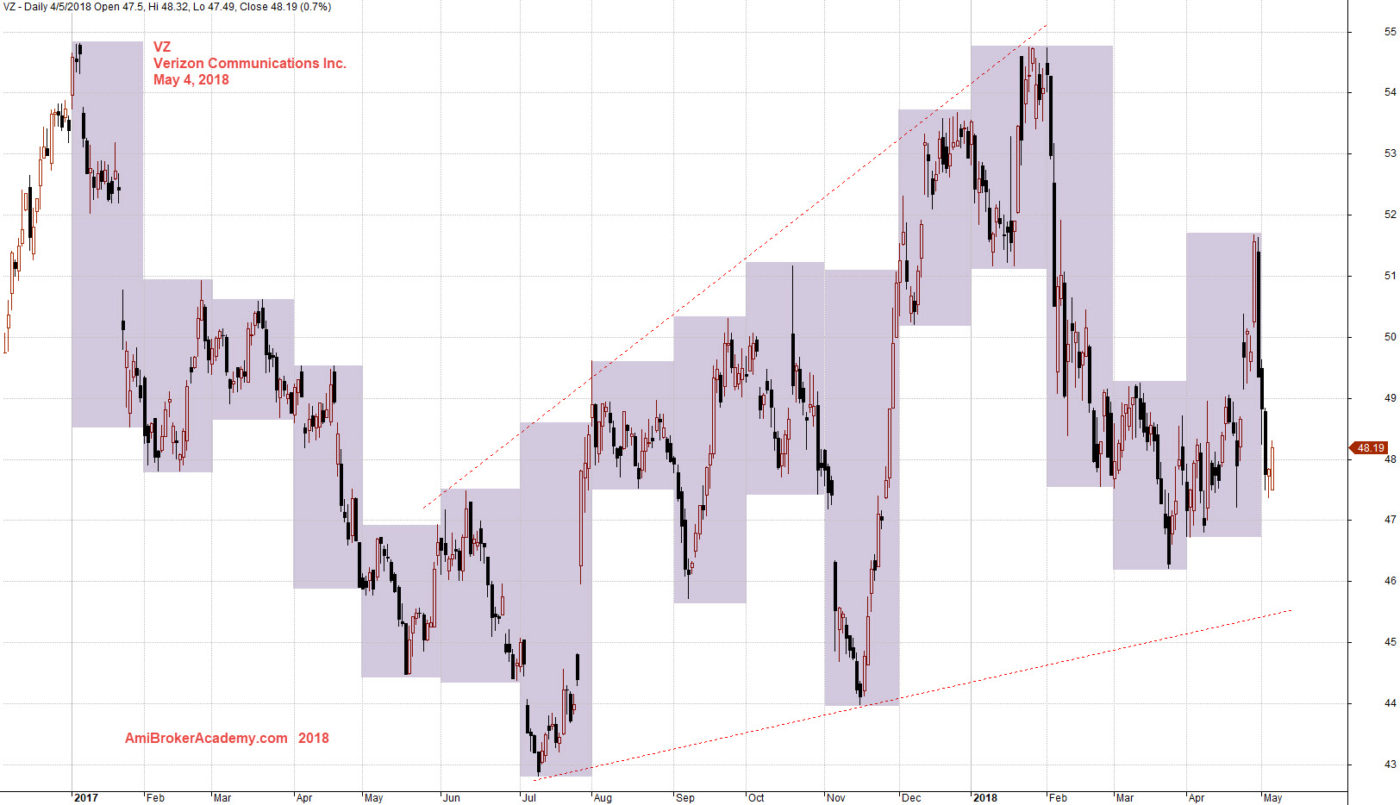
May 4, 2018 Verizon Communications Inc and Support Resistance
VZ Verizon Communications Inc and MACD
Let study the stock chart using another tool such as MACD indicator. See the MACD and MACD-H was below zeroline, and it cross above zeroline. Can this continue to stay above zeroline? Will see. Manage your risk.
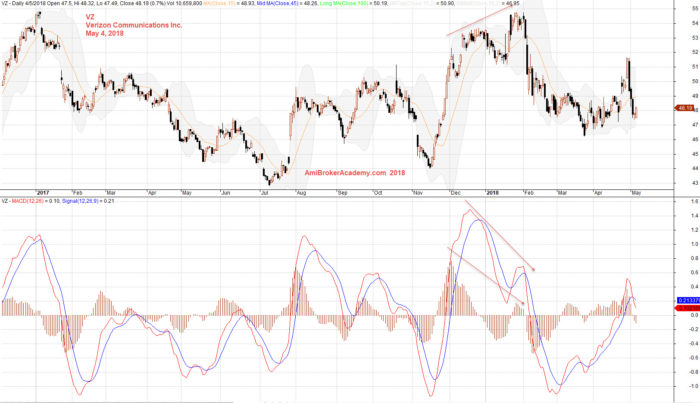
May 4, 2018 Verizon Communications Inc and MACD
Verizon Communications ranked number two in 2017. Let’s do a correlation in the next posting. Have fun!
Major Telco in US or Top 10 Telecom Companies in USA 2017
If you google the Top 10 Telecom companies in USA, and you will find a list like below.
The following are the Top Telecom Companies in USA 2017, the list are based on Revenue, Subscribers and Profit.
1st Place : AT&T
2nd Place : Verizon Communications
3rd Place : Comcast Corporation
4th Place : Charter Communications
5th Place : T-Mobile USA
6th Place : Sprint Corporation
7th Place : CenturyLink
8th Place : Dish Network
9th Place : Cox Communications
10th Place : US Cellular
Moses US Stock Desk
AmiBrokerAcademy.com
Disclaimer: All information, data and material contained, presented, or provided on amibrokeracademy.com is for educational purposes only. It is not to be construed or intended as providing trading or legal advice. Decisions you make about your trading or investment are important to you and your family, therefore should be made in consultation with a competent financial advisor or professional. We are not financial advisor and do not claim to be. Any views expressed here-in are not necessarily those held by amibrokeracademy.com. You are responsible for your trade decision and wealth being.