22 January 2019
Welcome to AmiBrokerAcademy.com. We provide US stock analysis for academy learning.
Think!
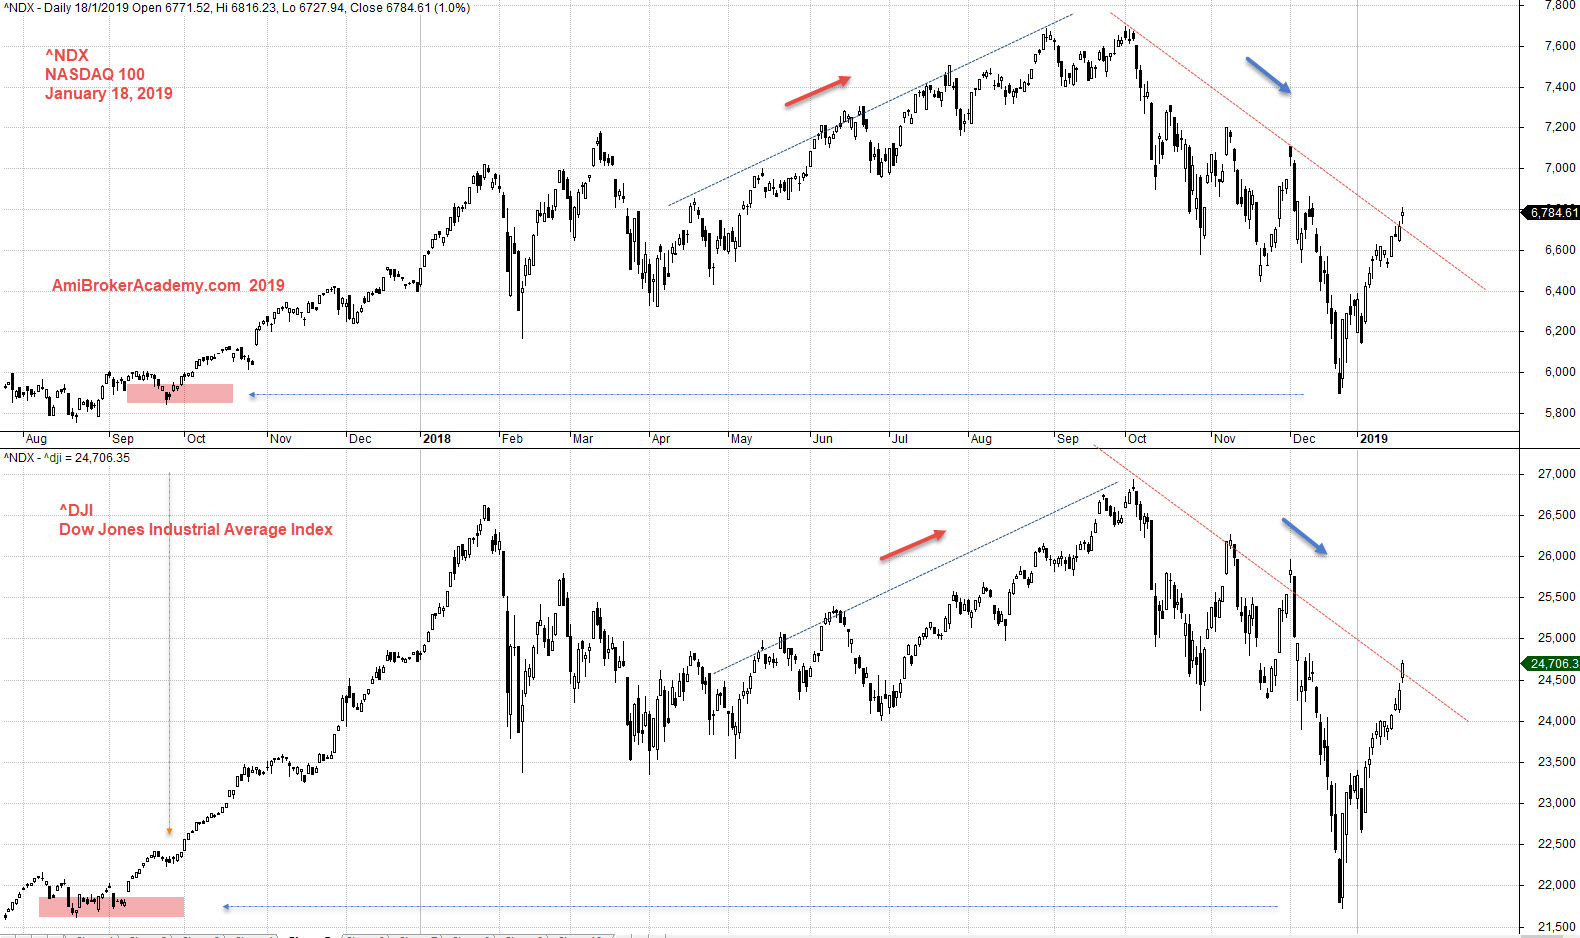
^NDX NASDAQ 100 Index and ^DJI Dow Jones Industrial Average Index Correlation Charting
Study the correlation of both US stock index
See chart, the gradient for both NASDAQ 100 Index and Dow Jones Industrial Average Index.
^NDX drop from the high from 7,600 points level to the low at 5,800 level. Now the index has rebounce to the high pass 6,600 level. Can the bounce continue to higher? Will see.
^DJI after retest the same high near 27,000 points level. The index has dropped to the low below 22,000 level. Now the price action has back to 24,500 level.
Trade with eyes open.
Moses Stock Analysis
AmiBrokerAcademy.com
Disclaimer
The above result is for illustration purpose. It is not meant to be used for buy or sell decision. We do not recommend any particular stocks. If particular stocks of such are mentioned, they are meant as demonstration of Amibroker as a powerful charting software and MACD. Amibroker can program to scan the stocks for buy and sell signals.
These are script generated signals. Not all scan results are shown here. The MACD signal should use with price action. Users must understand what MACD and price action are all about before using them. If necessary you should attend a course to learn more on Technical Analysis (TA) and Moving Average Convergence Divergence, MACD.
Once again, the website does not guarantee any results or investment return based on the information and instruction you have read here. It should be used as learning aids only and if you decide to trade real money, all trading decision should be your own.