4 July 2021
Welcome!
Welcome to AmiBroker Academy dot com, amibrokeracademy.com.
We translate what the price action tell us, ie Picture worth a thousand words. We publish Moses Don’t Play Play Chart almost daily, including sometimes Cryptocurrencies. Have fun!
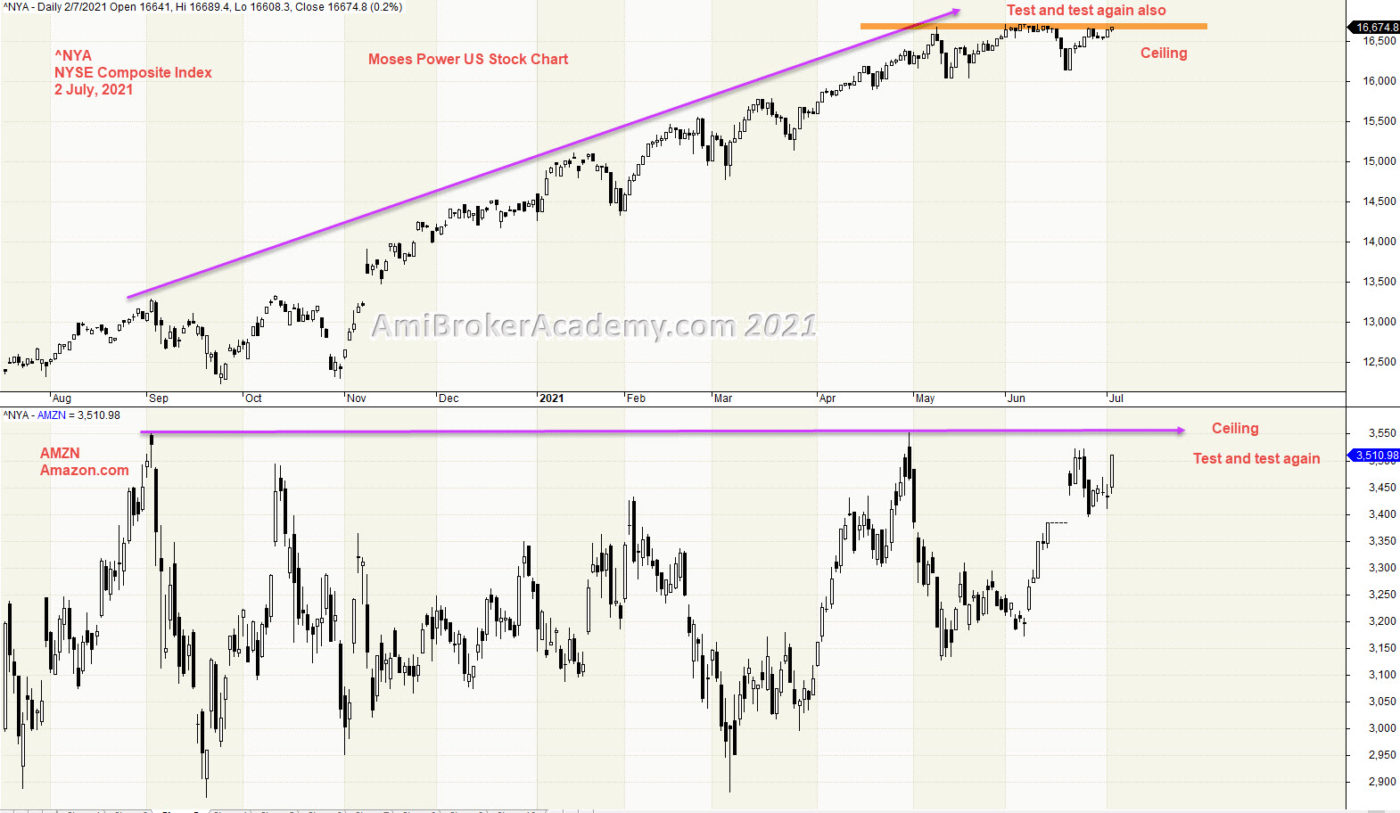
NYSE Composite Index and Amazon.com Correlation
Correlation chart is a good way to benchmark market verse the market you wanting to focus in. In the example here, we bench NASDAQ Index against Amazon.com Inc.
We see the price action of NASDAQ Composite Index continues to go higher until last two months, May and June, price action begin to hit the ceiling. In fact, benchmark Amazon, AMZN hits the ceiling even from last year September.
Manage risk is a key in trading. Trade with what you see.
Moses Free Charting
Moses Power Charting
Official AmiBrokerAcademy.com Charting
Disclaimer
The above result is for illustration purpose. It is not meant to be used for buy or sell decision. We do not recommend any particular stocks. If particular stocks of such are mentioned, they are meant as demonstration of Amibroker as a powerful charting software and MACD. Amibroker can program to scan the stocks for buy and sell signals.
These are script generated signals. Not all scan results are shown here. The MACD signal should use with price action. Users must understand what MACD and price action are all about before using them. If necessary you should attend a course to learn more on Technical Analysis (TA) and Moving Average Convergence Divergence, MACD.
Once again, the website does not guarantee any results or investment return based on the information and instruction you have read here. It should be used as learning aids only and if you decide to trade real money, all trading decision should be your own.
We learn from many past and present great traders. Kudo to these master.