12 March, 2020
Welcome!
Welcome to AmiBrokerAcademy.com. Thanks for visiting the site.
Have fun!
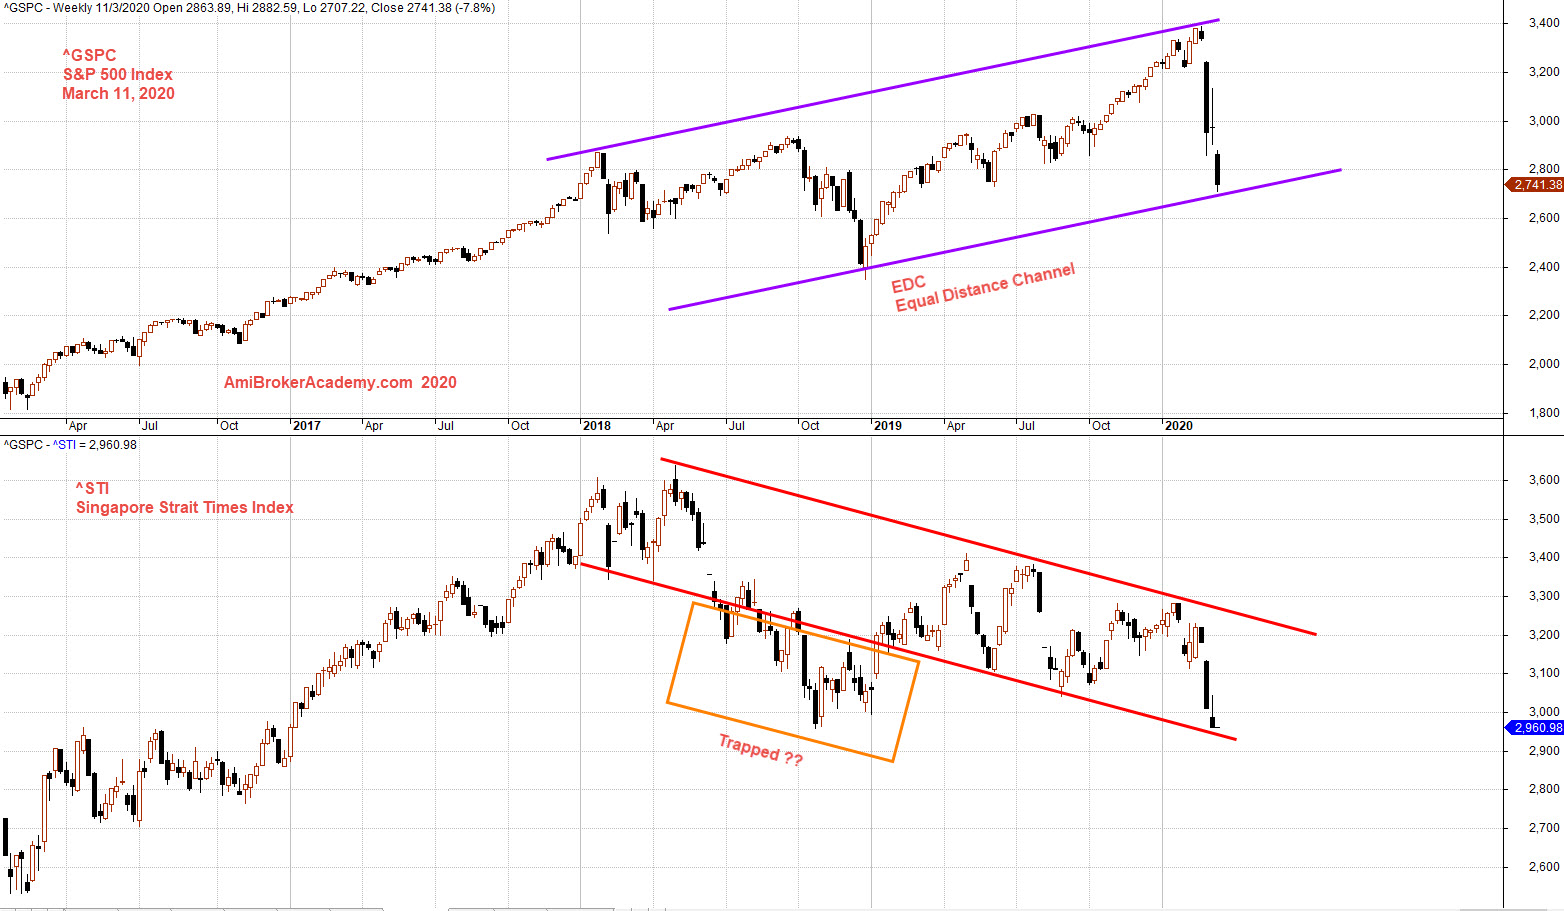
^GSPC S&P 500 Index and ^STI ST Index Correlation Charting
Study Weekly chart of Standard and Poor 500 and Straits Times Index Correlation stock chart price action and Channel.
See chart, picture worth a thousand words.
Manage your expectation.
Remember to trade what you see and not what you think.
Manage your risk.
At S&P 500 connect the peak to draw a trendline. Copy and paste the trendline to the low. We see the pullback or topping touch the lower band. The channel is slopping up, bull trend.
At ST Index, connect the peak and draw a trendline. Copy and paste the low. We see some price action fall below the lower band. Those were the bear trapped. Channel is slopping down, bear trend.
Moses Stock Observation
AmiBrokerAcademy.com
Disclaimer
The above result is for illustration purpose. It is not meant to be used for buy or sell decision. We do not recommend any particular stocks. If particular stocks of such are mentioned, they are meant as demonstration of Amibroker as a powerful charting software and MACD. Amibroker can program to scan the stocks for buy and sell signals.
These are script generated signals. Not all scan results are shown here. The MACD signal should use with price action. Users must understand what MACD and price action are all about before using them. If necessary you should attend a course to learn more on Technical Analysis (TA) and Moving Average Convergence Divergence, MACD.
Once again, the website does not guarantee any results or investment return based on the information and instruction you have read here. It should be used as learning aids only and if you decide to trade real money, all trading decision should be your own.