27 August, 2018
Singapore Stock Stories
Thanks for visiting the site.
M1 and Singtel Correlation Charting
Study M1 stock price. If we compare M1 with Singel, from their correlation can you find anything? From the boxes, looks like both are in sideways. Trade with your eyes open.
But remember, every trader see the chart differently. So, trade with your own believe. Have fun!
Manage your risk.
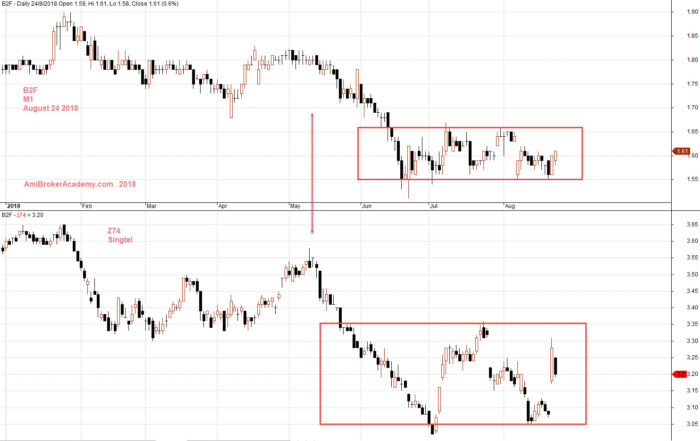
August 24, 2018 M1 Singtel Correlation Charting
Moses
AmiBrokerAcademy.com
Disclaimer
The above result is for illustration purpose. It is not meant to be used for buy or sell decision. We do not recommend any particular stocks. If particular stocks of such are mentioned, they are meant as demonstration of Amibroker as a powerful charting software and MACD. Amibroker can program to scan the stocks for buy and sell signals.
These are script generated signals. Not all scan results are shown here. The MACD signal should use with price action. Users must understand what MACD and price action are all about before using them. If necessary you should attend a course to learn more on Technical Analysis (TA) and Moving Average Convergence Divergence, MACD.
Once again, the website does not guarantee any results or investment return based on the information and instruction you have read here. It should be used as learning aids only and if you decide to trade real money, all trading decision should be your own.