27 December, 2018
Think think got more things.
Thanks for visiting the site.
Qualcomm and Apple has been in court case in China for sometimes. Recently Qualcomm asks the Chinese patent court to ban sales of the iPhone XS, iPhone XS Max, and iPhone XR in the region after its winning the Apple Inc infringed on two Qualcomm software patents lawsuit.
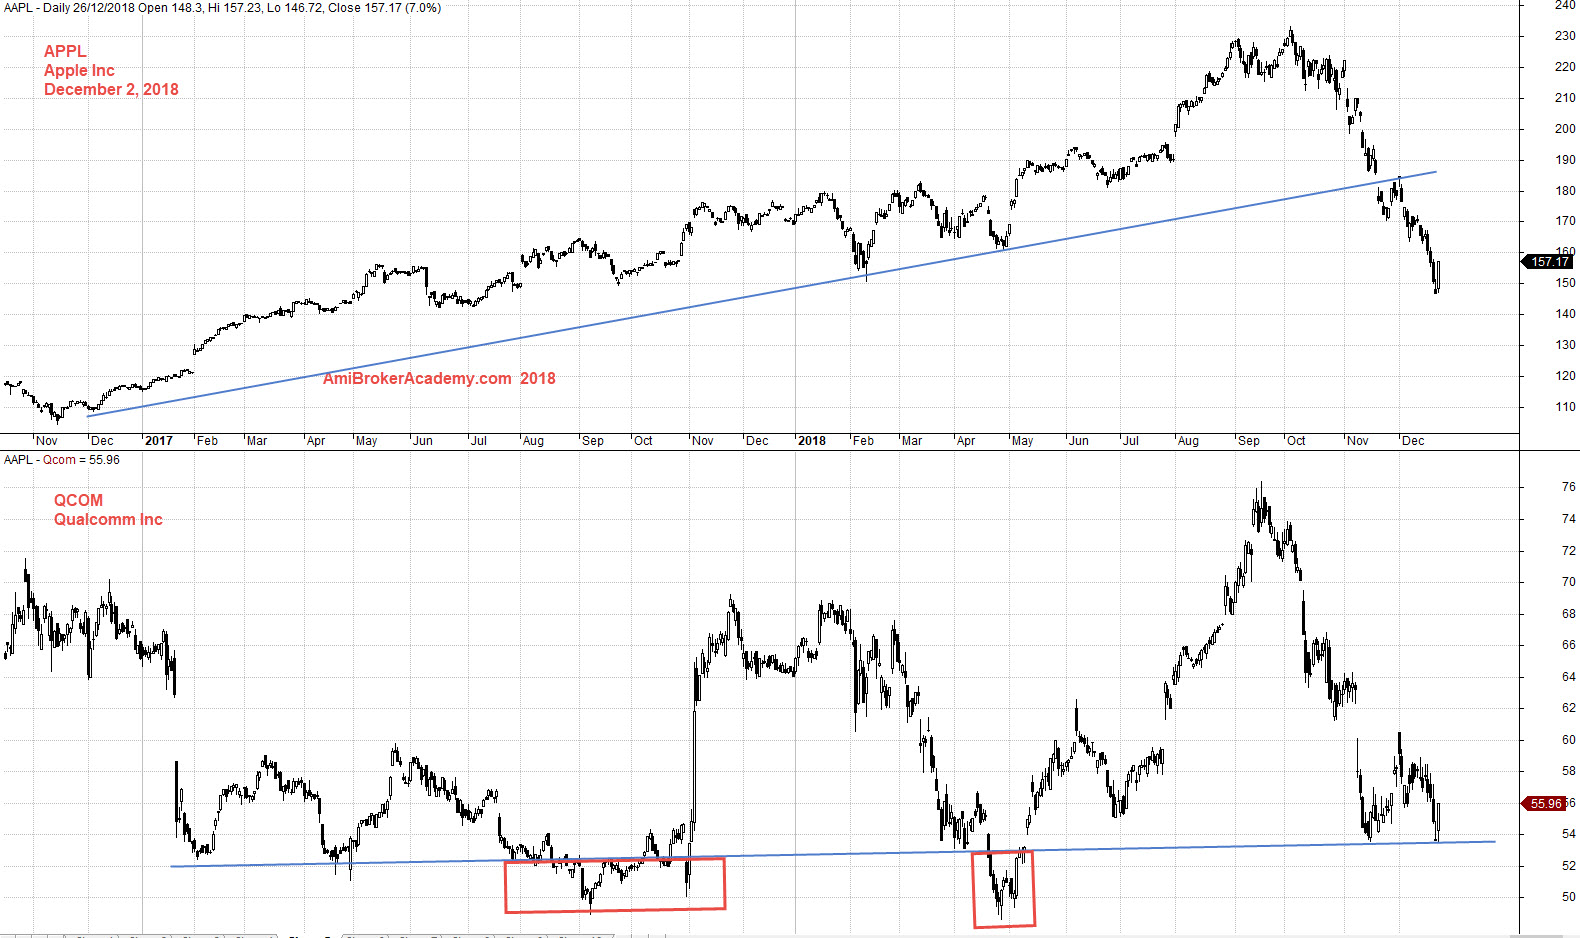
AAPL Apple Inc Daily and Qualcomm Inc Correlation Chart
We believe in Buy Low Sell High
in other words Buy Support Sell Resistance
Remember support resistance may not be necessary a horizontal line, it could be anything. Such as moving average or trendline.
Study Apple Inc and Qualcomm Inc Correlation chart, picture worth a thousand words, see chart.
Trade with your eyes open.
if you can see the full chart, “press Ctrl and -” to zoom out and see the entire chart.
Moses US Stock Chart Analysis
AmiBrokerAcademy.com
Disclaimer
The above result is for illustration purpose. It is not meant to be used for buy or sell decision. We do not recommend any particular stocks. If particular stocks of such are mentioned, they are meant as demonstration of Amibroker as a powerful charting software and MACD. Amibroker can program to scan the stocks for buy and sell signals.
These are script generated signals. Not all scan results are shown here. The MACD signal should use with price action. Users must understand what MACD and price action are all about before using them. If necessary you should attend a course to learn more on Technical Analysis (TA) and Moving Average Convergence Divergence, MACD.
Once again, the website does not guarantee any results or investment return based on the information and instruction you have read here. It should be used as learning aids only and if you decide to trade real money, all trading decision should be your own.