14 July 2021
Welcome!
Welcome to AmiBroker Academy dot com, amibrokeracademy.com.
We sometime bench mark stock price action for two stocks. The following example, we benchmark Foxconn Technology 富士康 and SMIC a China chip maker. Semiconductor Manufacturing International Corporation is a major chip maker in China. Besides that we use other tools such as 1) Ichimoku Cloud, 2) Support Resistance (using box), 3) River (moving average), 4) GMMA and Woodies CCI, 5) Bollinger Bands and Moving Averages, and 6) MACD to analyze chart. See our simple reading of price action. We read Cryptocurrencies price action chart too.
We translate price action chart into layman language. This will help you in understand the financial instrument you are trading. We believe picture worth a thousand words. So, sometimes we use less words. You can learn the price action interpretation too. Give it a tray. You may not have the same view points as us. Remember all analysis read price action chart differently. It is just like reading an essay, we will have different conclusion.
Trade well.
Trade what you see. Manage your risk.
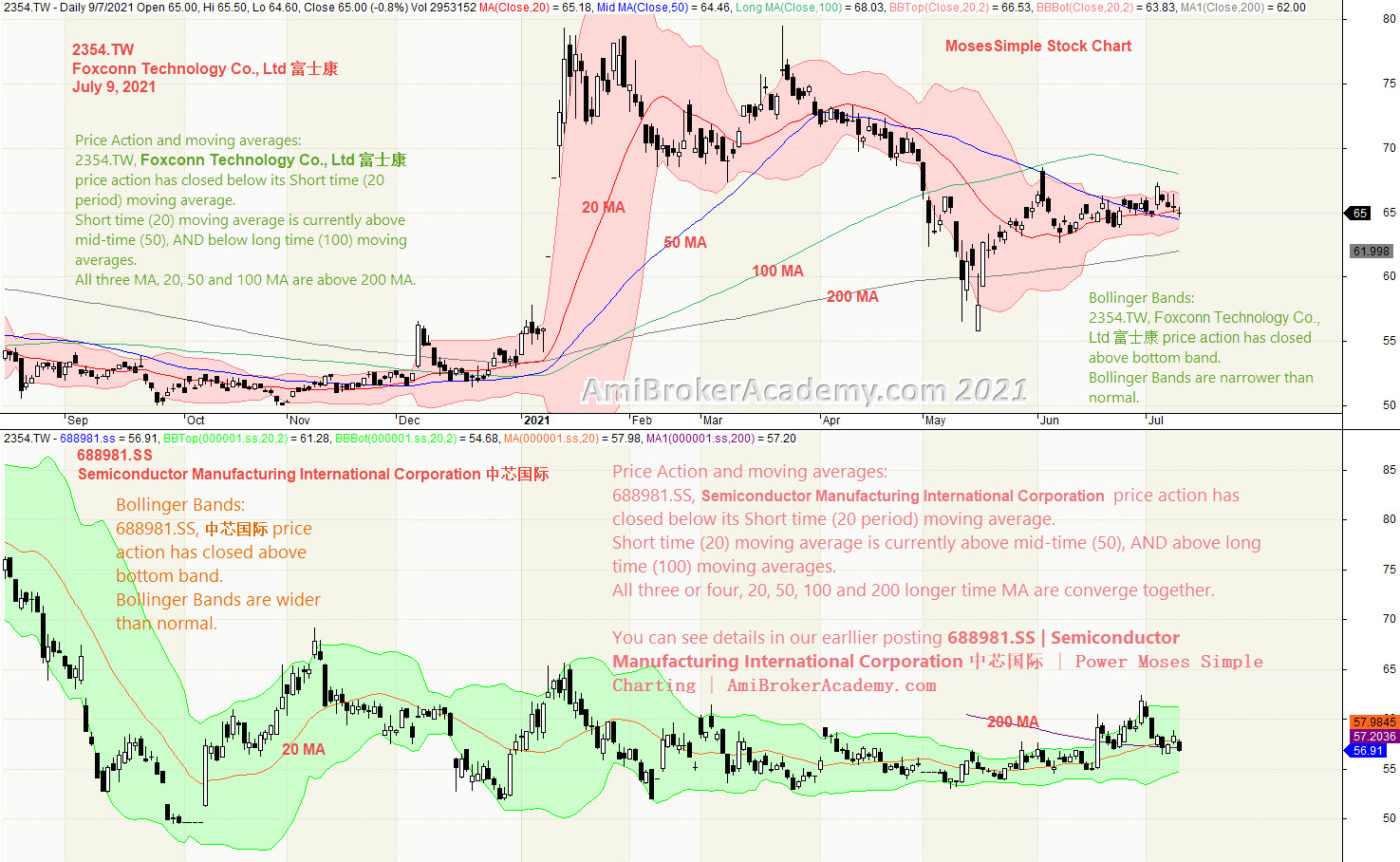
1) Foxconn Technology Co 富士康 and Semiconductor Manufacturing International Corporation aka SMIC 中芯国际 Correlation
We study price action we see Foxconn Technology 富士康 stock price bounce up and pullback. We see SMIC 中芯国际stock after retrace back to low and continue gliding very close to the “floor’. But, at the last part slightly close higher.
Trade what you see.
SMIC has a lot of potential, as there is a rush in chips market worldwide. Besides that the shortage in China market since US trade war started way back in Donald Trump day. Foxconn is s long time player in the component market. Trade what you see.
Remember, we just read what the chart said. Have fun!
Moses Power Charting
Official AmiBrokerAcademy.com Charting
Disclaimer
The above result is for illustration purpose. It is not meant to be used for buy or sell decision. We do not recommend any particular stocks. If particular stocks of such are mentioned, they are meant as demonstration of Amibroker as a powerful charting software and MACD. Amibroker can program to scan the stocks for buy and sell signals.
These are script generated signals. Not all scan results are shown here. The MACD signal should use with price action. Users must understand what MACD and price action are all about before using them. If necessary you should attend a course to learn more on Technical Analysis (TA) and Moving Average Convergence Divergence, MACD.
Once again, the website does not guarantee any results or investment return based on the information and instruction you have read here. It should be used as learning aids only and if you decide to trade real money, all trading decision should be your own.
We learn from many past and present great traders. Kudo to these master.