8 July 2021
Welcome!
Welcome to AmiBroker Academy dot com, amibrokeracademy.com.
We sometime bench mark stock price action with index such as Dow Index. The following example, we benchmark two US stock, Apple Inc stock and Tesla Inc stock. We use other tools such as 1) Ichimoku Cloud, 2) Support Resistance (using box), 3) River (moving average), 4) GMMA and Woodies CCI, 5) Bollinger Bands and Moving Averages, and 6) MACD to analyze chart. See our simple reading of price action. We read Cryptocurrencies price action chart too.
The following we use correlation to benchmark Apple Inc and Tesla Inc. You can find our benchmark of Apple Inc stock and Dow Index, see link. Correlation | Apple Inc and Dow Jones Index Correlation | Moses Power US Stock Chart | AmiBrokerAcademy.com.
We translate price action chart into layman language. This will help you in understand the financial instrument you are trading. We believe picture worth a thousand words. So, sometimes we use less words. You can learn the price action interpretation too. Give it a tray. You may not have the same view points as us. Remember all analysis read price action chart differently. It is just like reading an essay, we will have different conclusion.
Trade well.
Trade what you see. Manage your risk.
True or True
It is no secret, Apple Inc working to launch a car. Of course, the car should be a electric car. In 2014, Apple began working on “Project Titan, so eventually Apple Inc and Tesla Inc will be compete in the same market segment. Making benchmarking of both are becoming more and more valuable.
1) Apple Inc and Tesla Inc Correlation
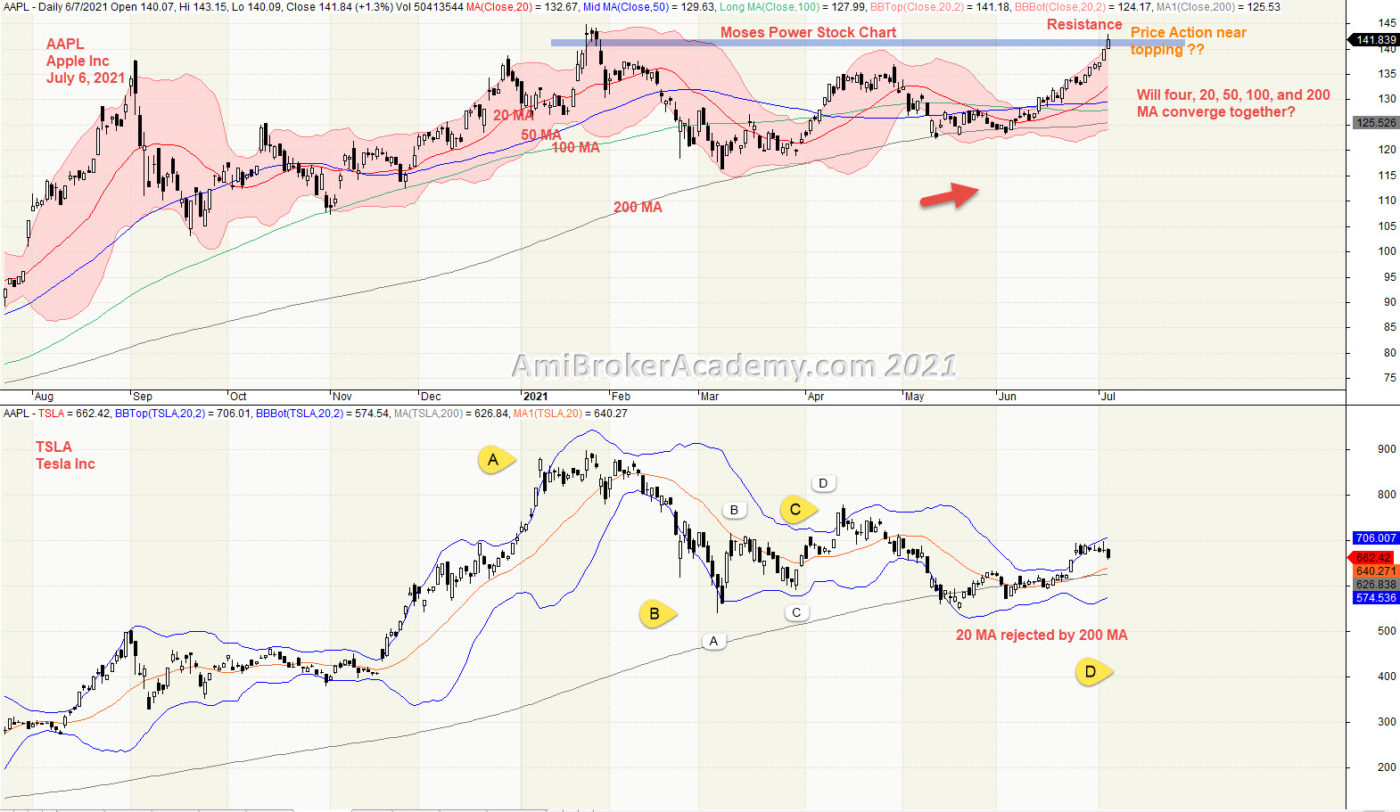
We use bollinger bands to envelop Apple Inc and Tesla Inc. Apple Inc has move from low to high in last August. Thereafter, Apple Inc stock price action fail to move higher, price action pullback to test the 100 MA. 100 MA slopping up and continue to provide support to the price action. Next, price action test the high as last September. Very quickly, the price action breakout higher than the high last December. Price Action again retrace down, this time price action gt the support from 200 MA. Price Action get supported by 200 MA twice. Now, price action retest the high in January.
Will the price action like the last few high, first pullback before it can reach out higher. Trade what you see.
Tesla Inc price action goes from low to high in January and pullback. Price Action now get supported by 200 MA. Price Action is near Bollinger Band upper band.
We just read what the chart said. Have fun!
We all read the same chart, but we may have different conclusion.
Moses Power Charting
Official AmiBrokerAcademy.com Charting
Disclaimer
The above result is for illustration purpose. It is not meant to be used for buy or sell decision. We do not recommend any particular stocks. If particular stocks of such are mentioned, they are meant as demonstration of Amibroker as a powerful charting software and MACD. Amibroker can program to scan the stocks for buy and sell signals.
These are script generated signals. Not all scan results are shown here. The MACD signal should use with price action. Users must understand what MACD and price action are all about before using them. If necessary you should attend a course to learn more on Technical Analysis (TA) and Moving Average Convergence Divergence, MACD.
Once again, the website does not guarantee any results or investment return based on the information and instruction you have read here. It should be used as learning aids only and if you decide to trade real money, all trading decision should be your own.
We learn from many past and present great traders. Kudo to these master.