16 February, 2019
Welcome to AmiBrokerAcademy.com. We provide US stock analysis for academy learning.
Think!
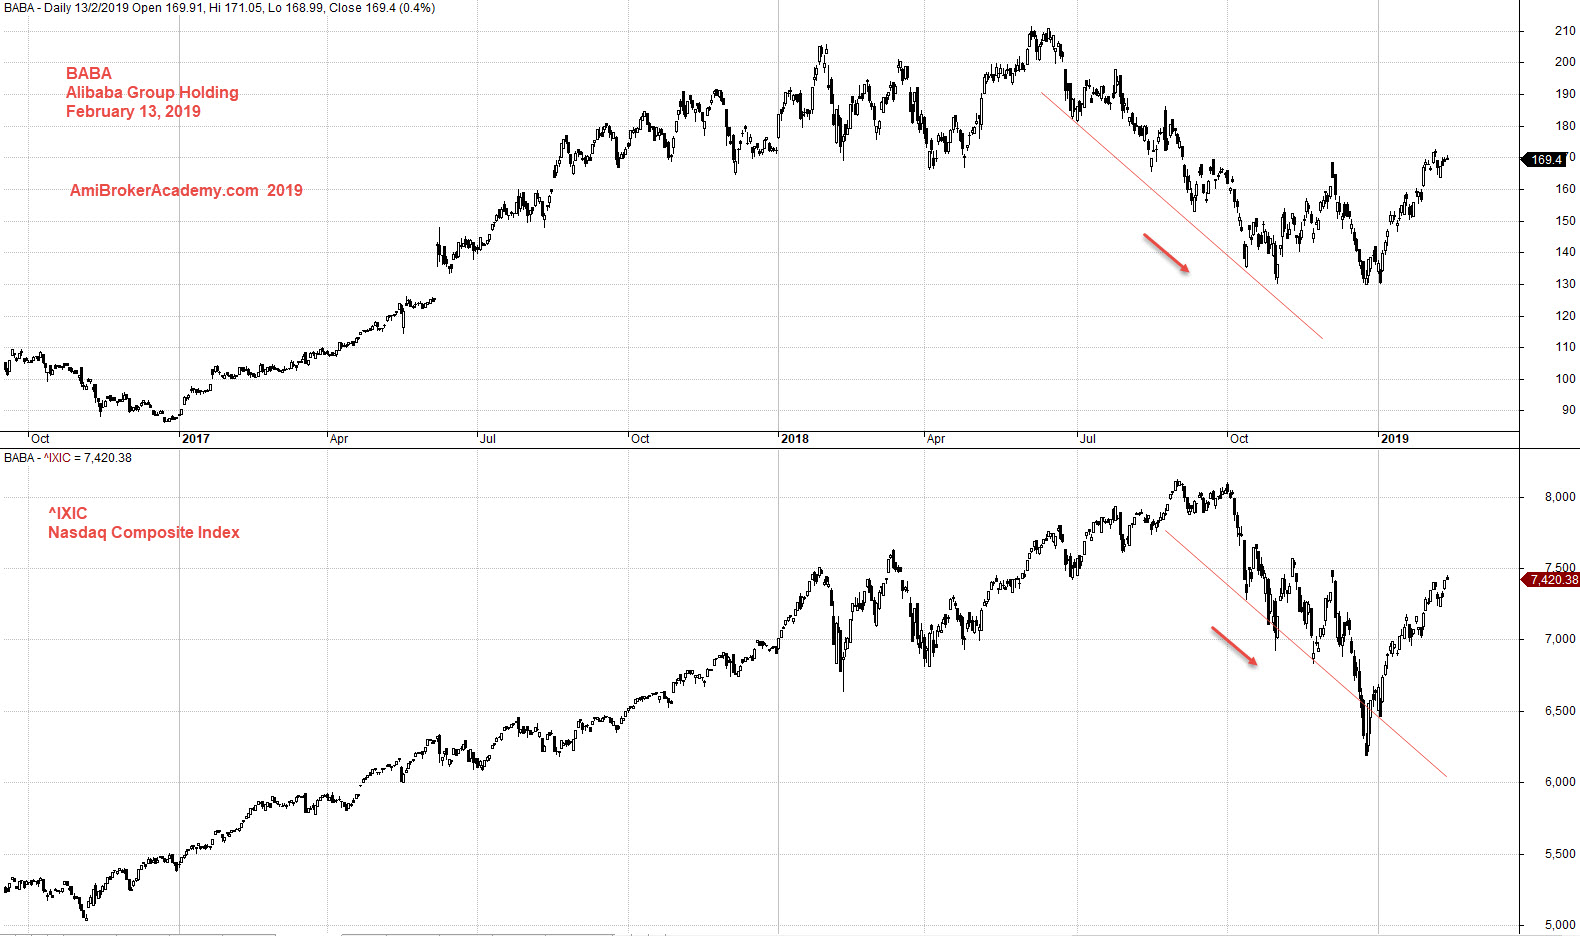
BABA Alibaba Group Holding Stock and US NASDAQ Composite Index Charting
Study Alibaba Group Holding and US NASDAQ Composite Index correlation charting.
BABA from June last year the stock begin to decline. Only until 2019 the stock price begin to pullback. See chart.
This is different from NASDAQ Index, ^IXIC only begin to decline after October last year. The Index also begin to pullback in last December.
Both may riding a similar gradient for the decline.
Trade with eyes open.
Moses Stock Analysis
AmiBrokerAcademy.com
Disclaimer
The above result is for illustration purpose. It is not meant to be used for buy or sell decision. We do not recommend any particular stocks. If particular stocks of such are mentioned, they are meant as demonstration of Amibroker as a powerful charting software and MACD. Amibroker can program to scan the stocks for buy and sell signals.
These are script generated signals. Not all scan results are shown here. The MACD signal should use with price action. Users must understand what MACD and price action are all about before using them. If necessary you should attend a course to learn more on Technical Analysis (TA) and Moving Average Convergence Divergence, MACD.
Once again, the website does not guarantee any results or investment return based on the information and instruction you have read here. It should be used as learning aids only and if you decide to trade real money, all trading decision should be your own.