30 December, 2019
Welcome to AmiBrokerAcademy.com. Thanks for visiting the site.
Happy 2020 Year Ahead.
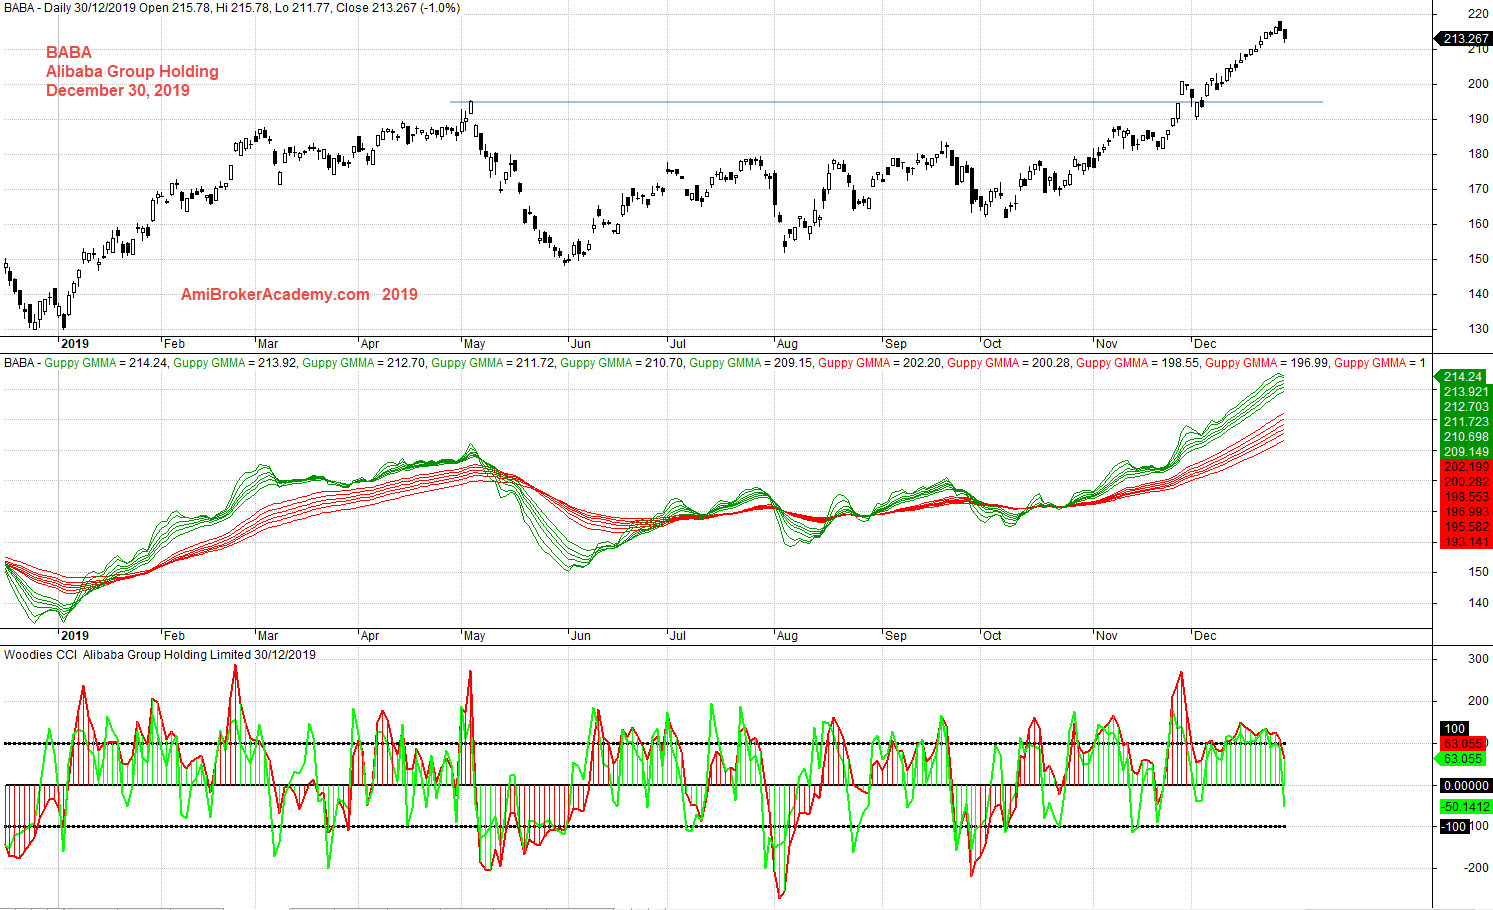
BABA Alibaba Group Holding Stock Stock Charting
Study Alibaba Group Holding stock chart price action and GMMA and Woodies CCI.
Look left and think right. Manage your expectation.
See chart, picture worth a thousand words.
Study the last twelve months, BABA stock performance. It is good for those whom bought the stock at the start of the year and do not sell so far.
Is it time to take profit? Will, the price action may have a pullback to test the resistance before continue the bull trend.
From GMMA, the slow and fast MA are wide apart, this signal that the pullback may not really happen. But, it is wise to monitor closely.
Trade with eyes open.
Moses Stock Observation
AmiBrokerAcademy.com
Disclaimer
The above result is for illustration purpose. It is not meant to be used for buy or sell decision. We do not recommend any particular stocks. If particular stocks of such are mentioned, they are meant as demonstration of Amibroker as a powerful charting software and MACD. Amibroker can program to scan the stocks for buy and sell signals.
These are script generated signals. Not all scan results are shown here. The MACD signal should use with price action. Users must understand what MACD and price action are all about before using them. If necessary you should attend a course to learn more on Technical Analysis (TA) and Moving Average Convergence Divergence, MACD.
Once again, the website does not guarantee any results or investment return based on the information and instruction you have read here. It should be used as learning aids only and if you decide to trade real money, all trading decision should be your own.