August 6, 2017
Open High Low Close OHLC
Singapore Stock Index, The Straits Times Index last four days results:
August 1, 2017 Open = 3321.50, High = 3338.26, Low = 3321.50, Close = 3338.20
August 2, 2017 Open = 3337.57, High = 3349.09, Low = 3321.65, Close = 3348.80
August 3, 2017 Open = 3335.67, High = 3343.71, Low = 3331.72, Close = 3342.92
Hong Kong Stock Index, The Hang Seng Index last four days results:
August 1, 2017 Open = 27326.04, High = 27558, Low = 27326.04, Close = 27540.23
August 2, 2017 Open = 27645.28, High = 27747.35, Low = 27570.5, Close = 27607.38
August 3, 2017 Open = 27533.51, High = 27601.05, Low = 27399.58, Close = 27549.38
Benchmark Singapore and Hong Kong Stock Index From 2000 to 2017
See chart for more, picture worth a thousand words.
The two indexes move in a similar trend.
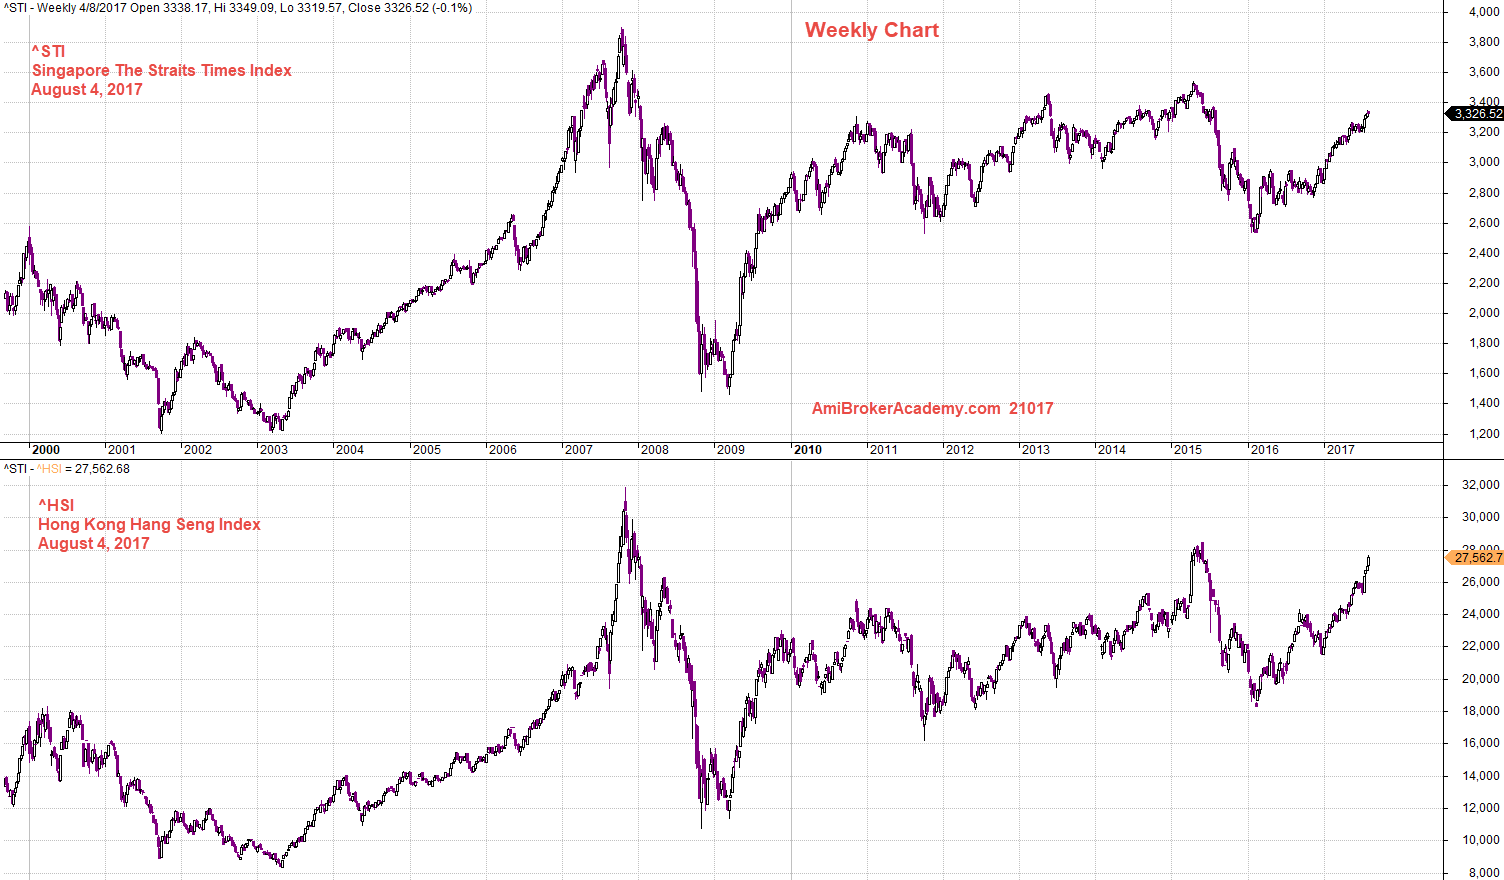
August 4, 2017 Singapore and Hong Kong Index Charting
Benchmark Singapore and Hong Kong Stock Index From 2000 to 2017 and Support Resistance
See chart for more, picture worth a thousand words.
The two indexes move in a similar trend. How do we know they are moving in the same or similar manner. Let marks the Support Resistance. Just study the resistance, chart is worth more than a thousand words. There are different. Clearly they are different.
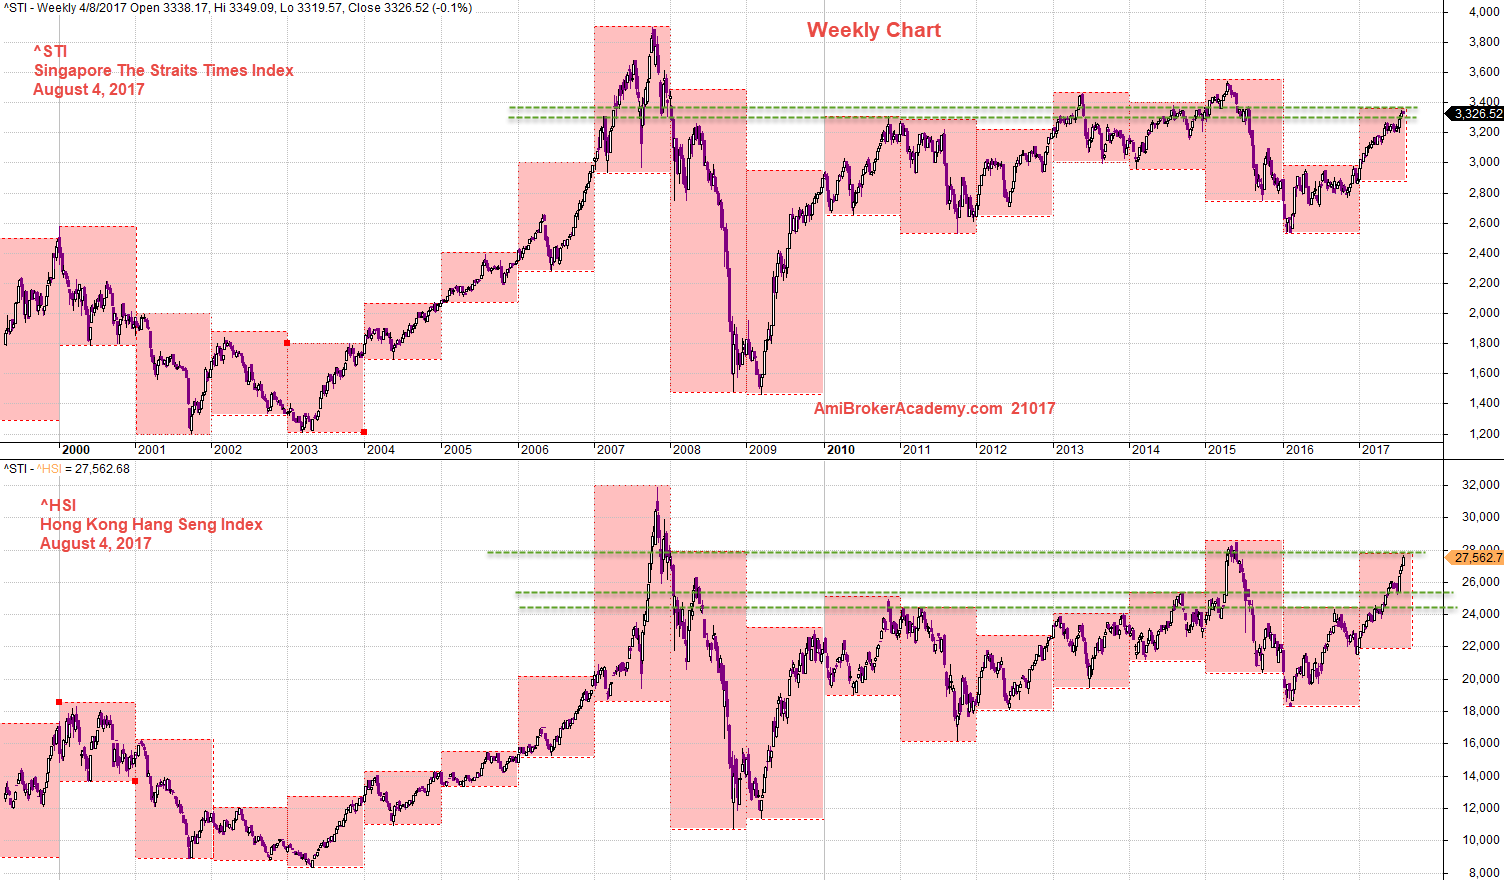
August 4, 2017 Benchmark Singapore and Hong Kong Stock Market Index and Support Resistance
^STI The Straits Times Index Weekly and Channel
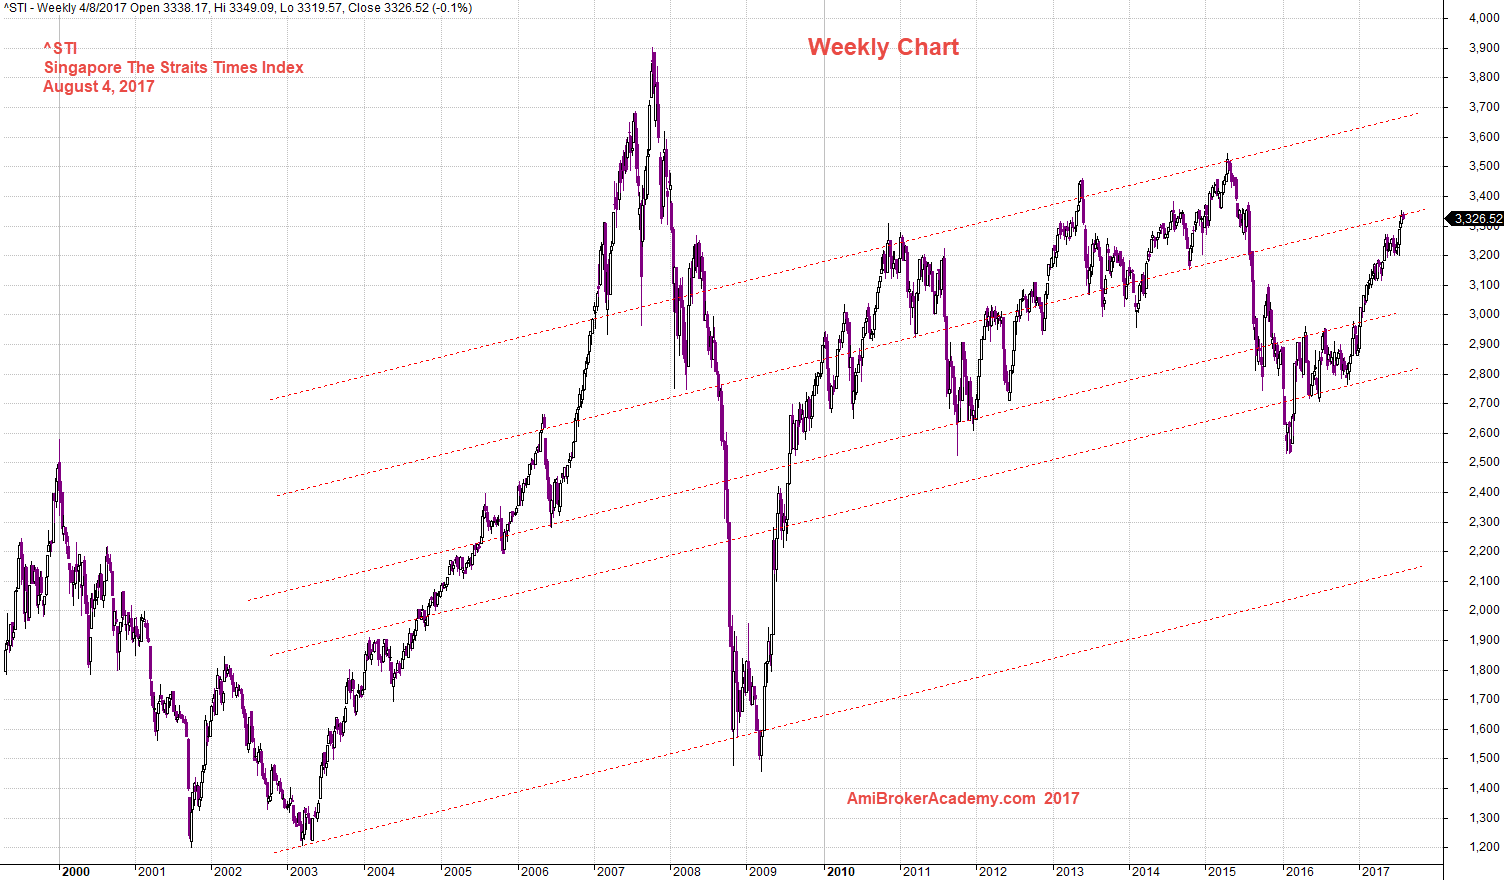
August 4, 2017 Singapore The Straits Times Index and Channels
^HSI The Hang Seng Index Weekly and Channel
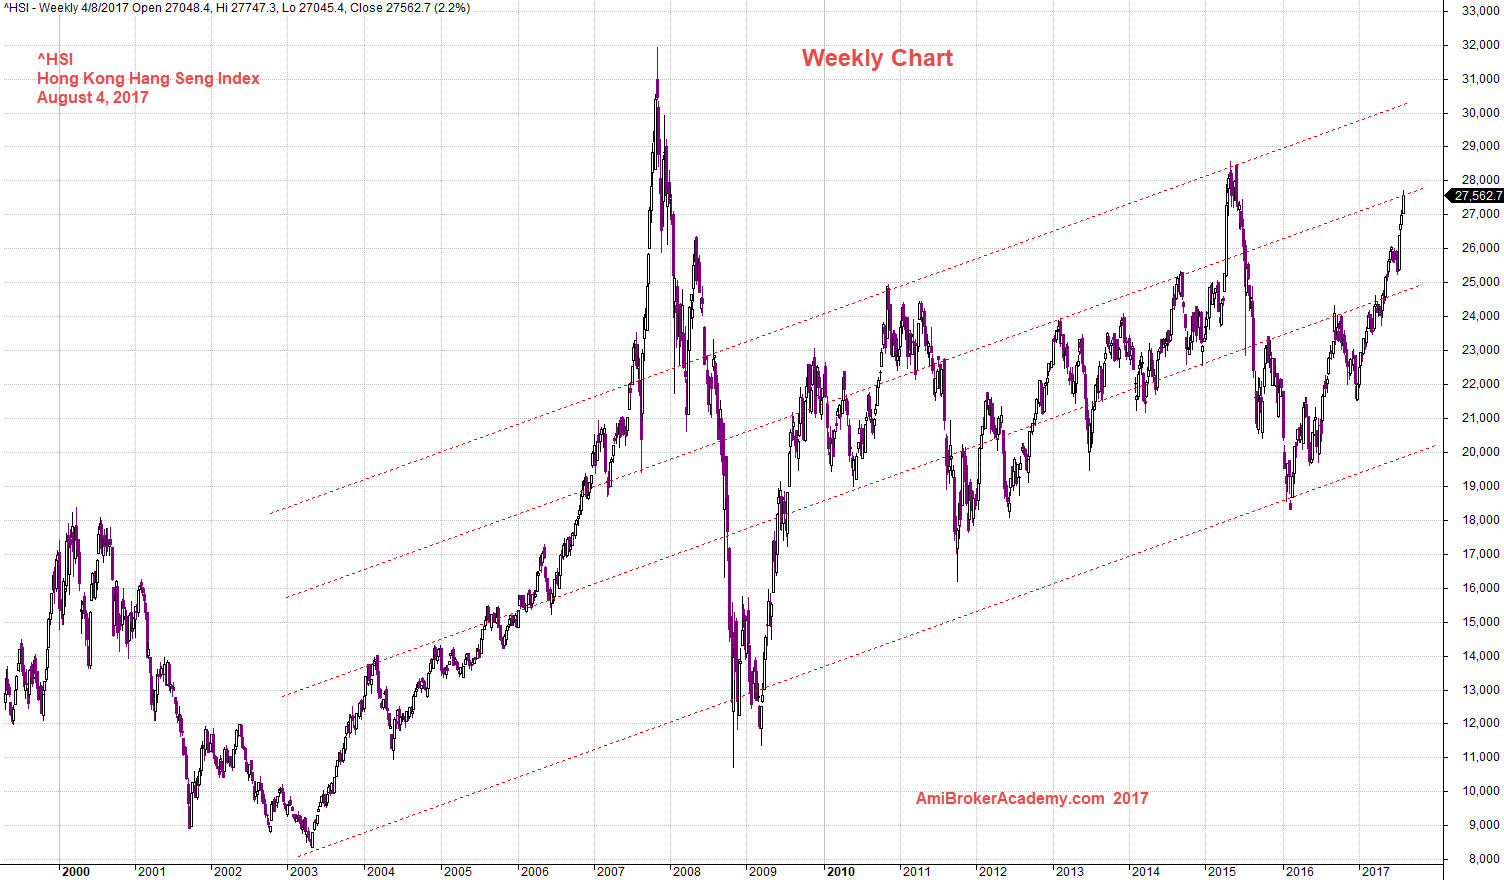
August 4, 2017 Hong Kong Hang Seng Index and Channel
Thanks for visit the site here. You could also find free MACD scan here in this site too.
Moses
AmiBrokerAcademy.com
Disclaimer
The above result is for illustration purpose. It is not meant to be used for buy or sell decision. We do not recommend any particular stocks. If particular stocks of such are mentioned, they are meant as demonstration of Amibroker as a powerful charting software and MACD. Amibroker can program to scan the stocks for buy and sell signals.
These are script generated signals. Not all scan results are shown here. The MACD signal should use with price action. Users must understand what MACD and price action are all about before using them. If necessary you should attend a course to learn more on Technical Analysis (TA) and Moving Average Convergence Divergence, MACD.
Once again, the website does not guarantee any results or investment return based on the information and instruction you have read here. It should be used as learning aids only and if you decide to trade real money, all trading decision should be your own.