July 18, 2018
Thanks for visiting the site.
We studied SSEC in early this month with Fibonacci.
Moses Stock Stories – Thinking Out Loud
Shanghai Stock Exchange Composite Index and Candlestick Pattern
We did a half year analysis on 上海证交所综合指数 price action. When you see the half year as one candlestick, you will see an engulfing candlestick pattern, a bearish engulfing candlestick pattern. See chart, picture worth a thousand words.
Trade with eyes open. Manage your risk.
Manage Your Risk!
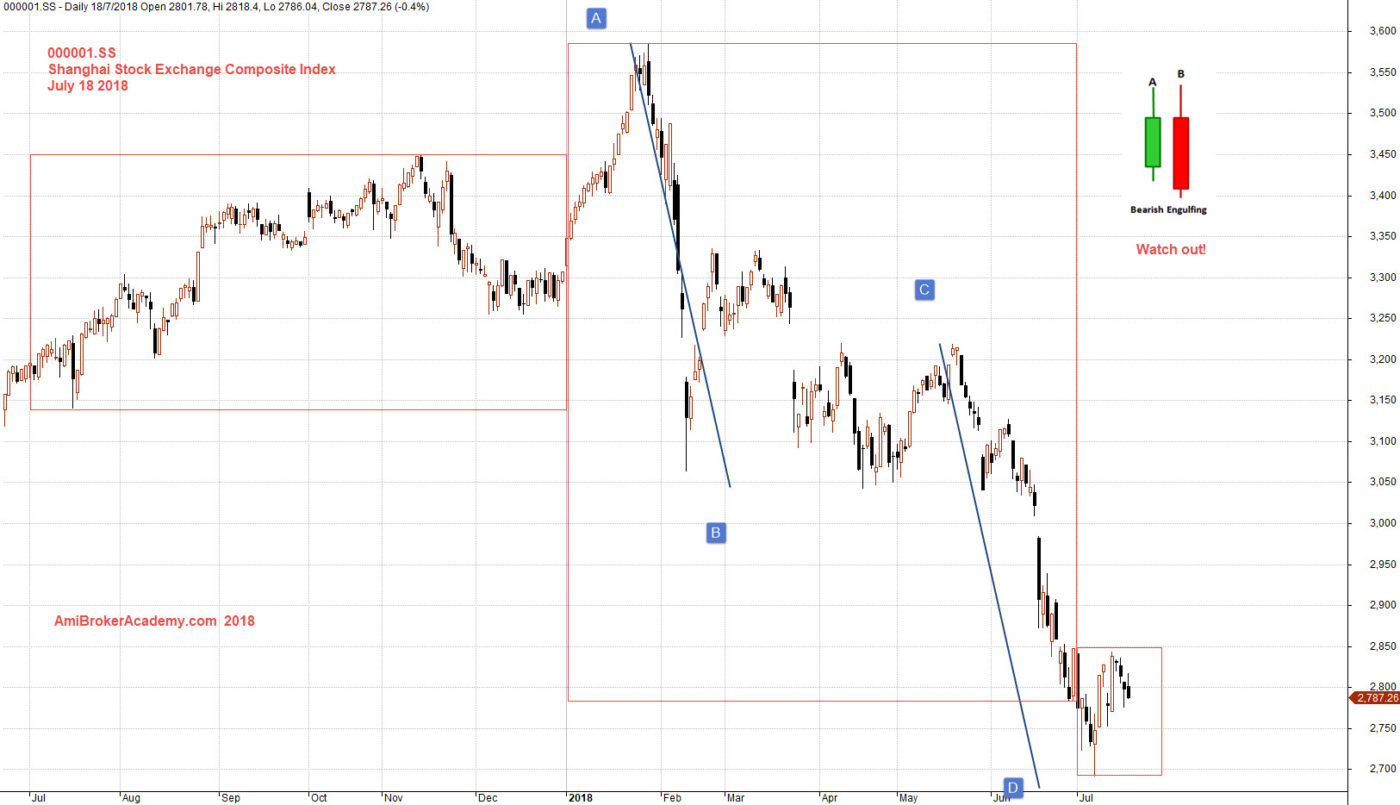
July 18, 2018 Shanghai Stock Exchange Composite Index and Bearish Engulfing
Shanghai Stock Exchange Composite Index and Moving Averages
See chart, picture worth a thousand words. The price action continue to form lower lower and lower high. Check moving averages, see MA is continue to slop down. Manage your trades.
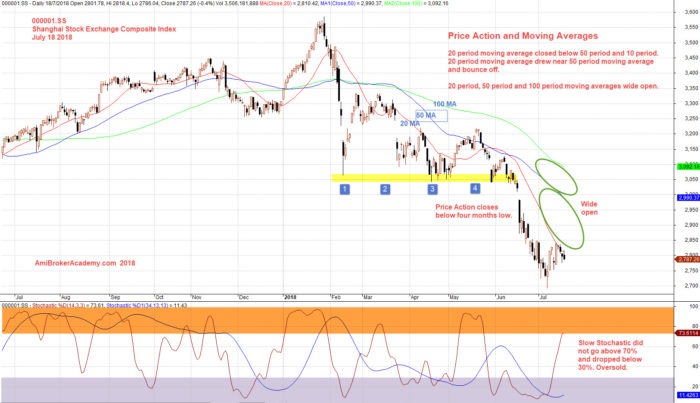
July 18, 2018 Shanghai Stock Exchange Composite Index and Moving Averages
Moses
AmiBrokerAcademy.com
Disclaimer
The above result is for illustration purpose. It is not meant to be used for buy or sell decision. We do not recommend any particular stocks. If particular stocks of such are mentioned, they are meant as demonstration of Amibroker as a powerful charting software and MACD. Amibroker can program to scan the stocks for buy and sell signals.
These are script generated signals. Not all scan results are shown here. The MACD signal should use with price action. Users must understand what MACD and price action are all about before using them. If necessary you should attend a course to learn more on Technical Analysis (TA) and Moving Average Convergence Divergence, MACD.
Once again, the website does not guarantee any results or investment return based on the information and instruction you have read here. It should be used as learning aids only and if you decide to trade real money, all trading decision should be your own.