5 November, 2018
Thanks for visiting the site.
Moses Stock Stories – Thinking Out Loud
600015.SS 华夏银行 Hua Xia Bank Co Charting
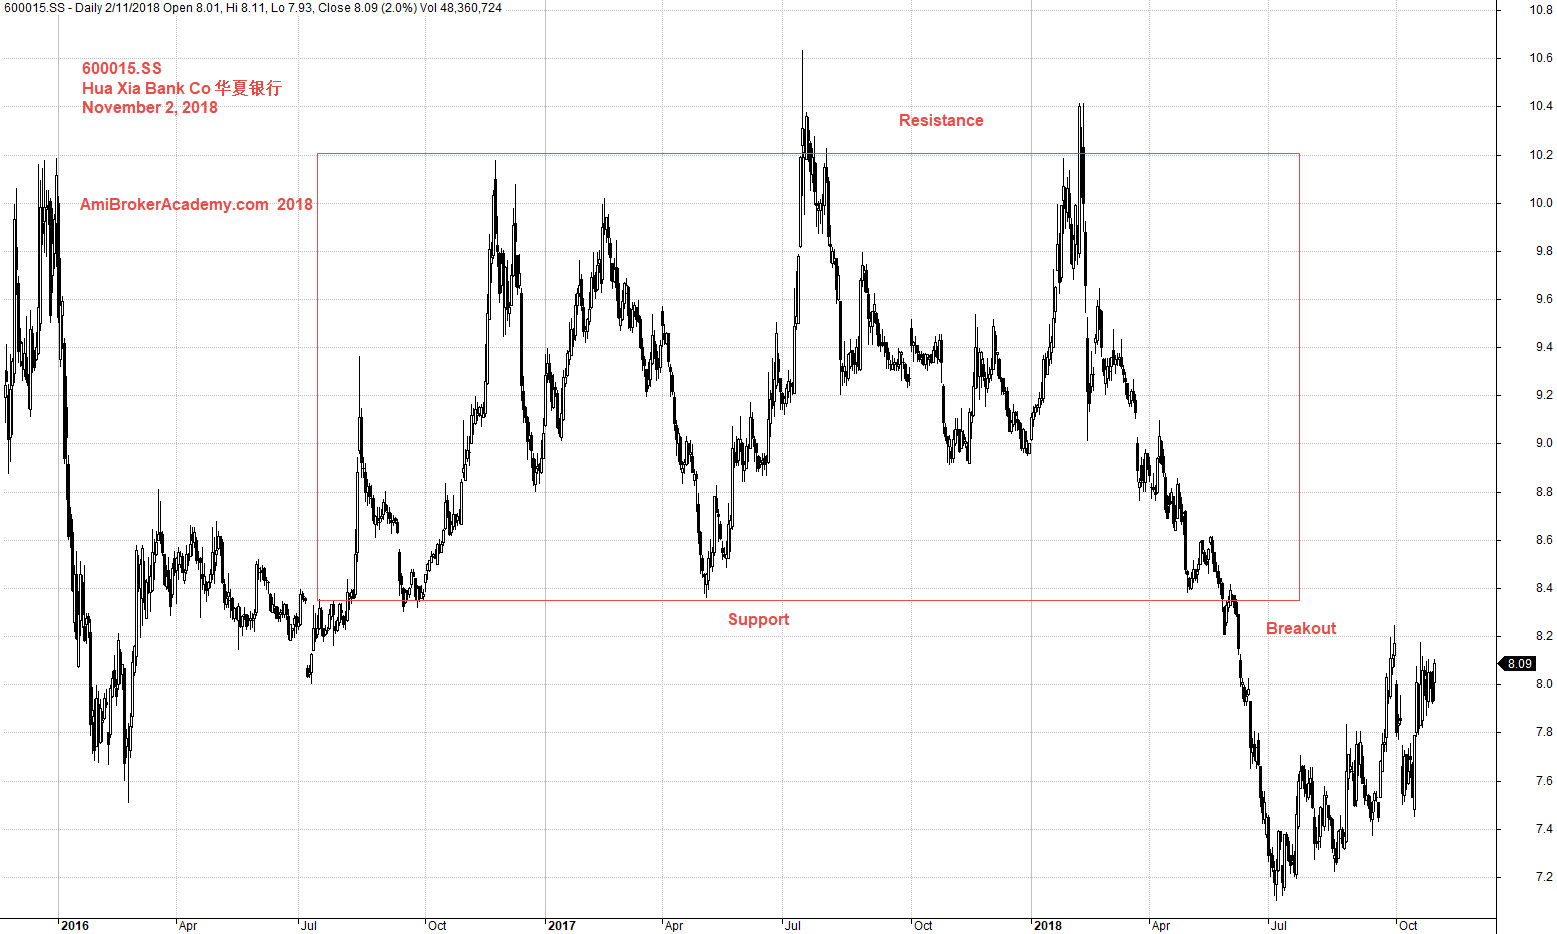
We did a study on 华夏银行 Hua Xia Bank Co stock chart. See chart, picture worth a thousand words. Price action try to breakout higher, but after three years, the stock price fail to break above 10.6, the stock price drift south.
At that time we felt to catch the falling knife, you may be very worry, as the price fail to go higher. See the last posting. Now the price action has gone a bit higher. See chart.
We add a box, see the price action try to test the support, see chart.
Manage Your Risk!
China Stock Analysis | 600015.SS 华夏银行 Hua Xia Bank Co Charting | AmiBrokerAcademy.com
November 2, 2018 Hua Xia Bank Co 华夏银行 Charting
If add a MACD indicator, see chart. The MACD has gone from bearish bias to bullish bias.
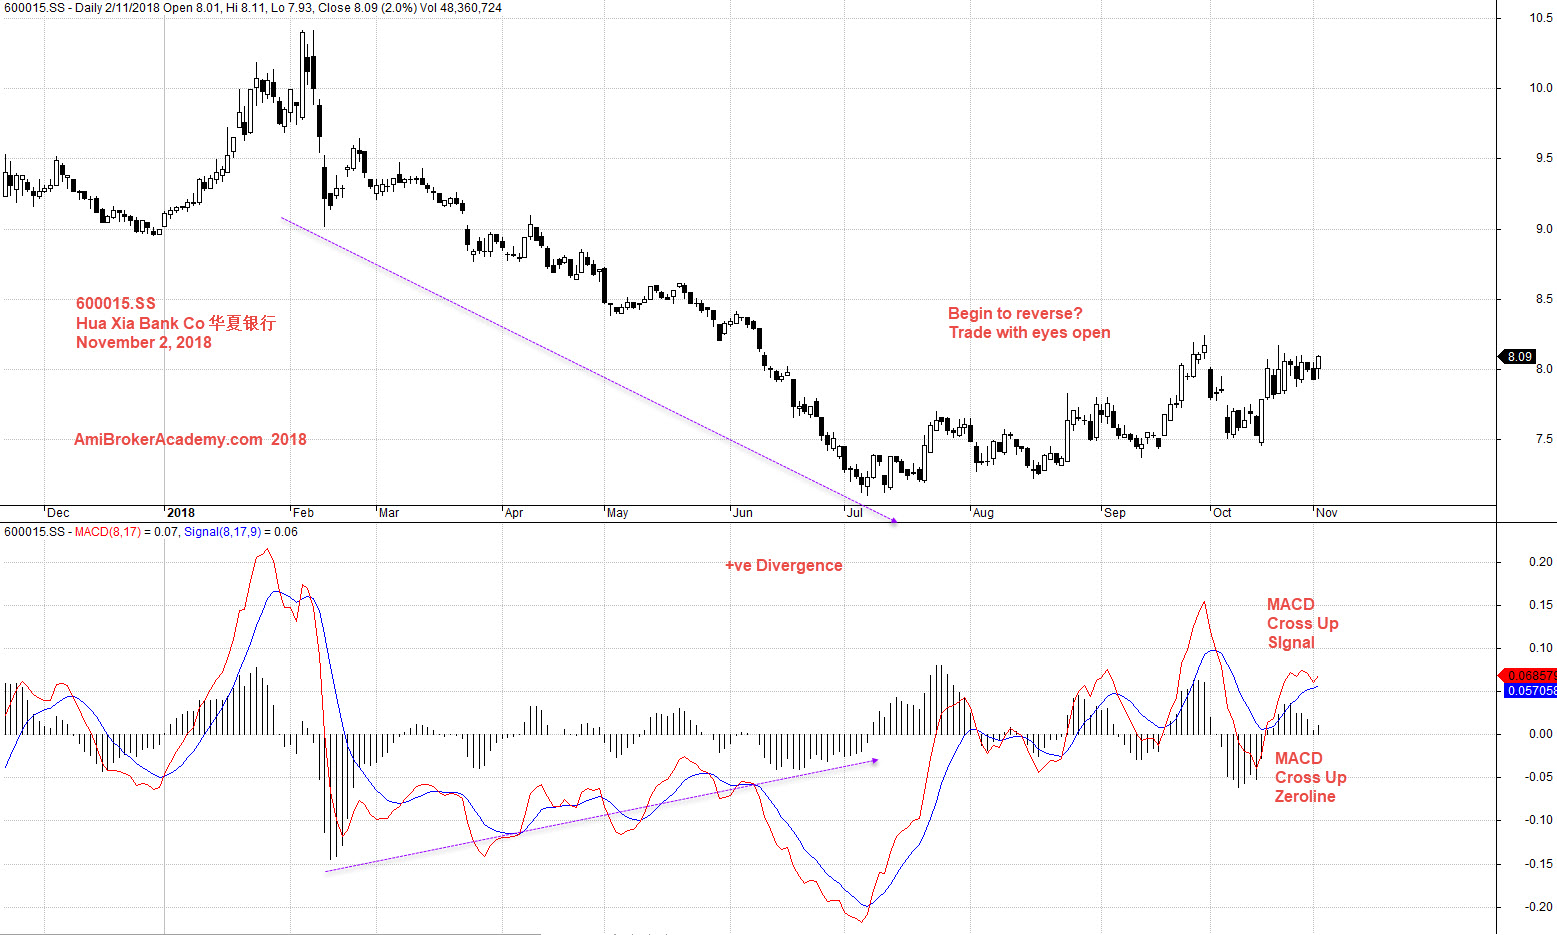
November 2, 2018 Hua Xia Bank Co 华夏银行 and MACD
Moses
AmiBrokerAcademy.com
Disclaimer
The above result is for illustration purpose. It is not meant to be used for buy or sell decision. We do not recommend any particular stocks. If particular stocks of such are mentioned, they are meant as demonstration of Amibroker as a powerful charting software and MACD. Amibroker can program to scan the stocks for buy and sell signals.
These are script generated signals. Not all scan results are shown here. The MACD signal should use with price action. Users must understand what MACD and price action are all about before using them. If necessary you should attend a course to learn more on Technical Analysis (TA) and Moving Average Convergence Divergence, MACD.
Once again, the website does not guarantee any results or investment return based on the information and instruction you have read here. It should be used as learning aids only and if you decide to trade real money, all trading decision should be your own.