June 7, 2017
China Huaguan Science (Stock Code: 600371.SS) Charting and MACD Indicator
Picture worth a thousand words.
In June 15 two years ago, (June 15, 2015) the stock hit the top of 35.33 Yen, and on the same year September 18, the stock was touch down to 10.14 yen. Thereafter it is like a dead cat bouncing. The stock price is very interesting like roller coaster ride. In fact before it hit the top, it was racing from the bottom from 6.785 yen at January 30, 2014.
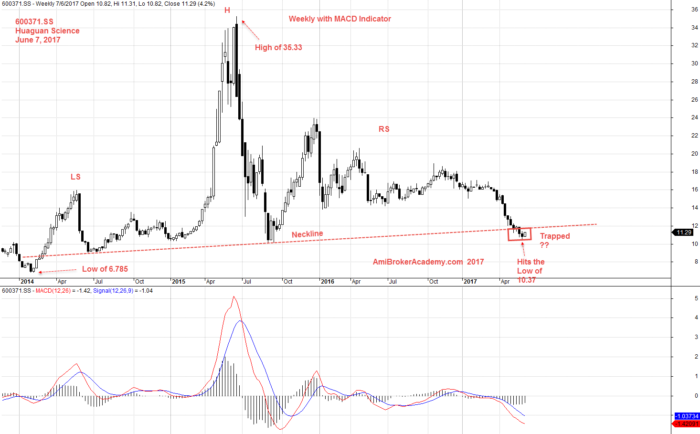
June 7, 2017 China Stock Huaguan Science Weekly and MACD Indicator
The analysis here is intended to be a tutorial only. We look at the chart from different views. We mainly study the popular stocks in US market and Singapore. Hope you can learn something. There is no right no wrong.
Moses Stock Analysis
AmiBrokerAcademy.com
Disclaimer
The above result is for illustration purpose. It is not meant to be used for buy or sell decision. We do not recommend any particular stocks. If particular stocks of such are mentioned, they are meant as demonstration of Amibroker as a powerful charting software and MACD. Amibroker can program to scan the stocks for buy and sell signals.
These are script generated signals. Not all scan results are shown here. The MACD signal should use with price action. Users must understand what MACD and price action are all about before using them. If necessary you should attend a course to learn more on Technical Analysis (TA) and Moving Average Convergence Divergence, MACD.
Once again, the website does not guarantee any results or investment return based on the information and instruction you have read here. It should be used as learning aids only and if you decide to trade real money, all trading decision should be your own.