27 July, 2019
Welcome to AmiBrokerAcademy.com. Thanks for visiting the site.
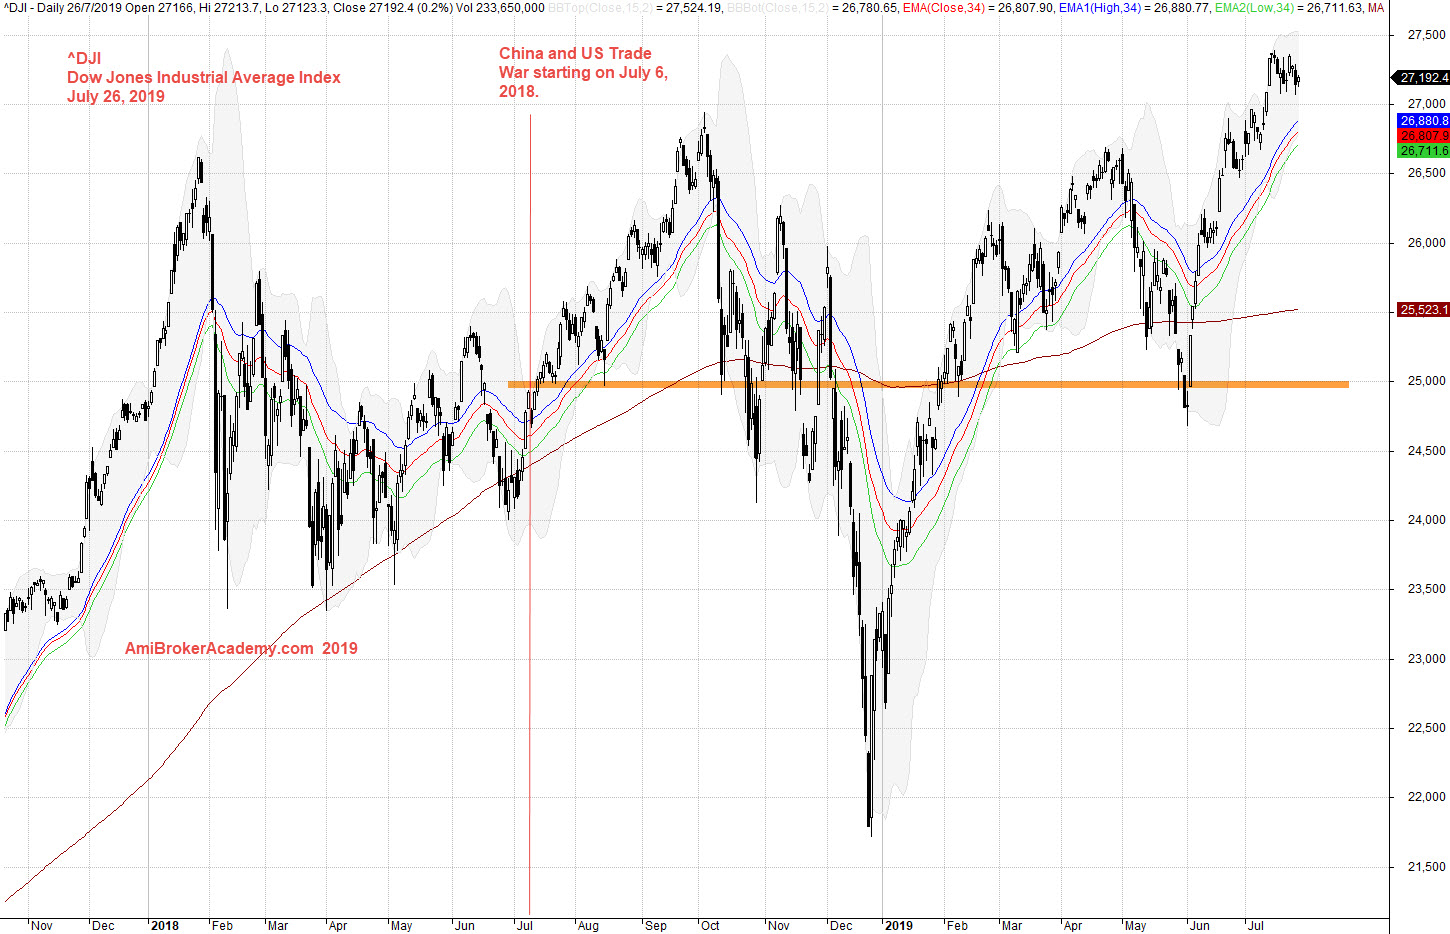
^DJI Dow Jones Industrial Average Stock Charting
Study Dow Jones Industrial Average Stock chart and River.
See chart, picture worth a thousand words.
River uses three moving averages of the same period, but from its high, low and close. As moving average is a great visual tool, so river provide a great visual effect a normal moving average.
When river slopping up and price action above river, bull trend. When river slopping down and price action below river, bear trend.
Study Dow Jones Industrial Average on since China and US trade war. See chart, price action above 25,000 level and below 25,000 level. Now, the market seems to except the trade war is part of the lifestyle. Price action has been bulling after 2019.
Trade with your eyes open.
Moses Stock Observation
AmiBrokerAcademy.com
Disclaimer
The above result is for illustration purpose. It is not meant to be used for buy or sell decision. We do not recommend any particular stocks. If particular stocks of such are mentioned, they are meant as demonstration of Amibroker as a powerful charting software and MACD. Amibroker can program to scan the stocks for buy and sell signals.
These are script generated signals. Not all scan results are shown here. The MACD signal should use with price action. Users must understand what MACD and price action are all about before using them. If necessary you should attend a course to learn more on Technical Analysis (TA) and Moving Average Convergence Divergence, MACD.
Once again, the website does not guarantee any results or investment return based on the information and instruction you have read here. It should be used as learning aids only and if you decide to trade real money, all trading decision should be your own.