27 October, 2018
Thanks for visiting the site.
BAC Bank of America Corporation and ^IXIC NASDAQ Composite Index Daily Correlation Charting
Buy Support Sell Resistance
Buy Low Sell High
Study chart of Bank of America Corporation and NASDAQ Composite Index correlation stock chart. See those highlighted in brown, out of three, two will in the opposite direction except one which on year 2014 was about the same. Bank of America Corporation is one of the major bank for America, why the stock price and the stock market index are not in the similar steps. Trade with your eyes open.
Manage your risk.
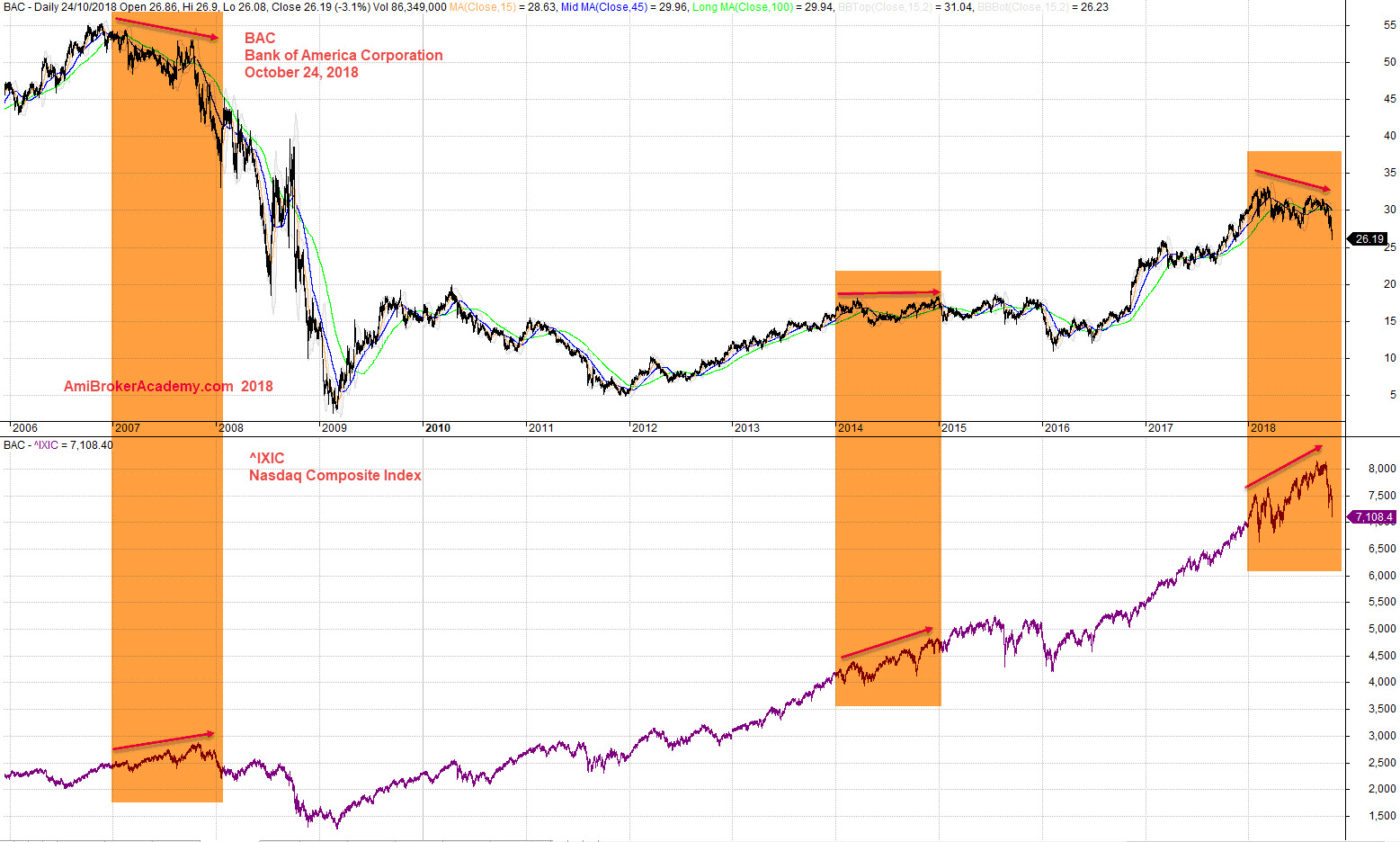
October 24, 2018 Bank of America Corporation and NASDAQ Composite Index Correlation
if you can see the full chart, “press Ctrl and -” to zoom out and see the entire chart.
Moses US Stock Chart Analysis
AmiBrokerAcademy.com
Disclaimer
The above result is for illustration purpose. It is not meant to be used for buy or sell decision. We do not recommend any particular stocks. If particular stocks of such are mentioned, they are meant as demonstration of Amibroker as a powerful charting software and MACD. Amibroker can program to scan the stocks for buy and sell signals.
These are script generated signals. Not all scan results are shown here. The MACD signal should use with price action. Users must understand what MACD and price action are all about before using them. If necessary you should attend a course to learn more on Technical Analysis (TA) and Moving Average Convergence Divergence, MACD.
Once again, the website does not guarantee any results or investment return based on the information and instruction you have read here. It should be used as learning aids only and if you decide to trade real money, all trading decision should be your own.