June 24, 2017
Professional Try Not to Buy and Sell Higher!
Professional trade on retracement.
What if you thought you miss and you jump in. You may be ended up you can not sleep for a days. … As you might be buy high and expecting to sell higher.
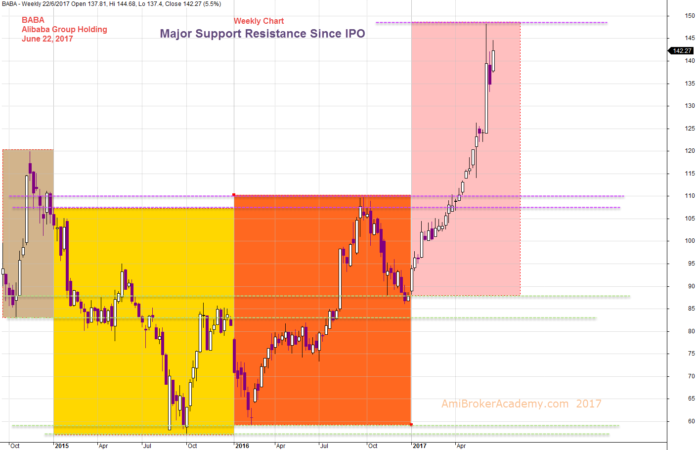
Alibaba Group Holding and Historical Major Support Resistance
If you like to buy thing, you got to know Alibaba, this is the Chinese eBay.
Picture worth a thousand words.
We see the price cross up major Resistance. And you could see second up trend is about the same distance of the first bullish trend. Is it about time for another pullback before bouncing up again? Do you know? I don’t.
Trade retracement, be careful, do not end up buy high and expect to sell higher. You would not be able to sleep well after. …
June 22, 2017 Alibaba Group Holding and Major Support Resistance Since IPO
BABA Alibaba Group Holding and Channel and Trend
Picture worth a thousand words. What have you got out of the chart? The trend is up and the price action are trapped within Channel. When the price action breakout of the existing channel, the price action are into another phase.
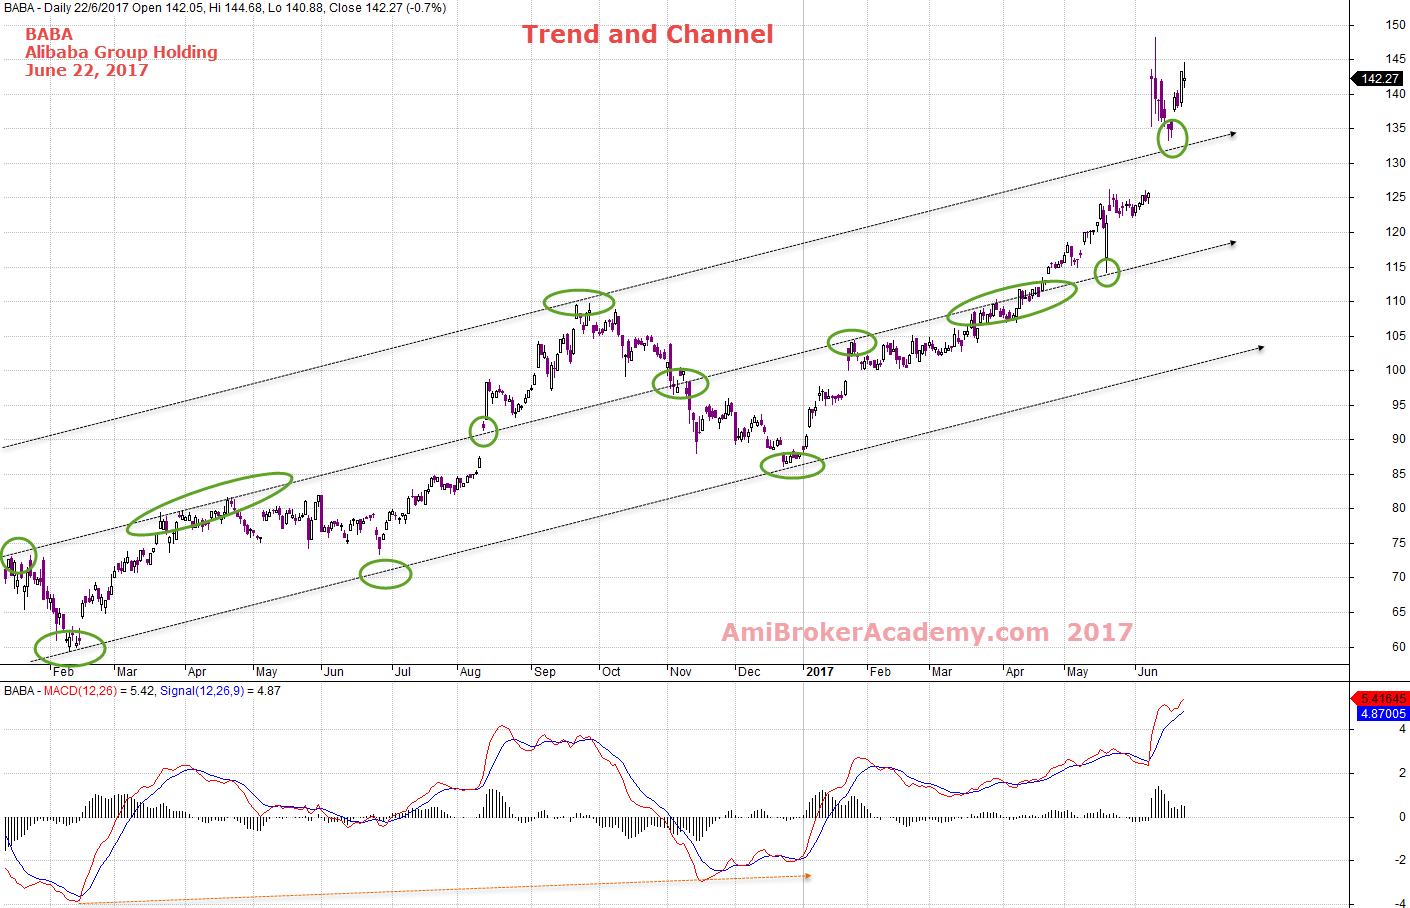
June 22, 2017 Alibaba Group Holding and Trend and Channel
Alibaba and NASDAQ Composite Index and ABCD Chart Pattern
Picture worth a thousand words. Can you easily find ABCD Chart pattern? Both seem move in a similar path.
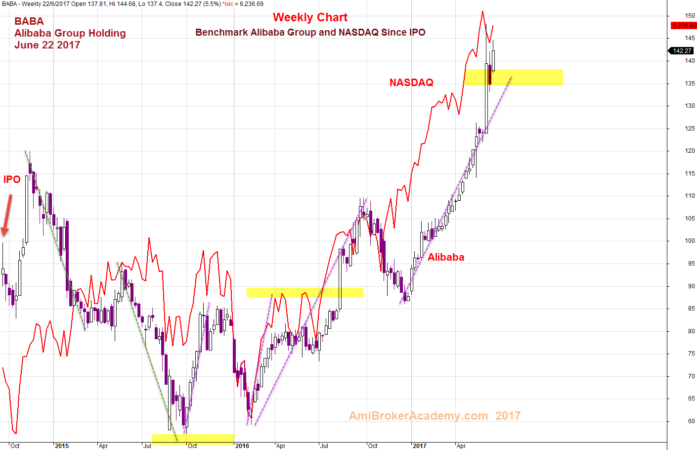
June 22, 2017 Alibaba Group and NASDAQ Composite Index
Risk
If you can wait, remember professional likes to wait for retracement. This will minimize the risk, as your stop loss will be smaller. So, picture worth a thousand words. In this case study, if you wait for pullback, you will have a handson gain; you can enjoy a big move in short time. Waw!
Moses
AmiBrokerAcademy.com
Disclaimer
The above result is for illustration purpose. It is not meant to be used for buy or sell decision. We do not recommend any particular stocks. If particular stocks of such are mentioned, they are meant as demonstration of Amibroker as a powerful charting software and MACD. Amibroker can program to scan the stocks for buy and sell signals.
These are script generated signals. Not all scan results are shown here. The MACD signal should use with price action. Users must understand what MACD and price action are all about before using them. If necessary you should attend a course to learn more on Technical Analysis (TA) and Moving Average Convergence Divergence, MACD.
Once again, the website does not guarantee any results or investment return based on the information and instruction you have read here. It should be used as learning aids only and if you decide to trade real money, all trading decision should be your own.