May 26, 2019
Welcome!
Welcome to AmiBrokerAcademy.com. Thanks for visiting the site.
Have fun!
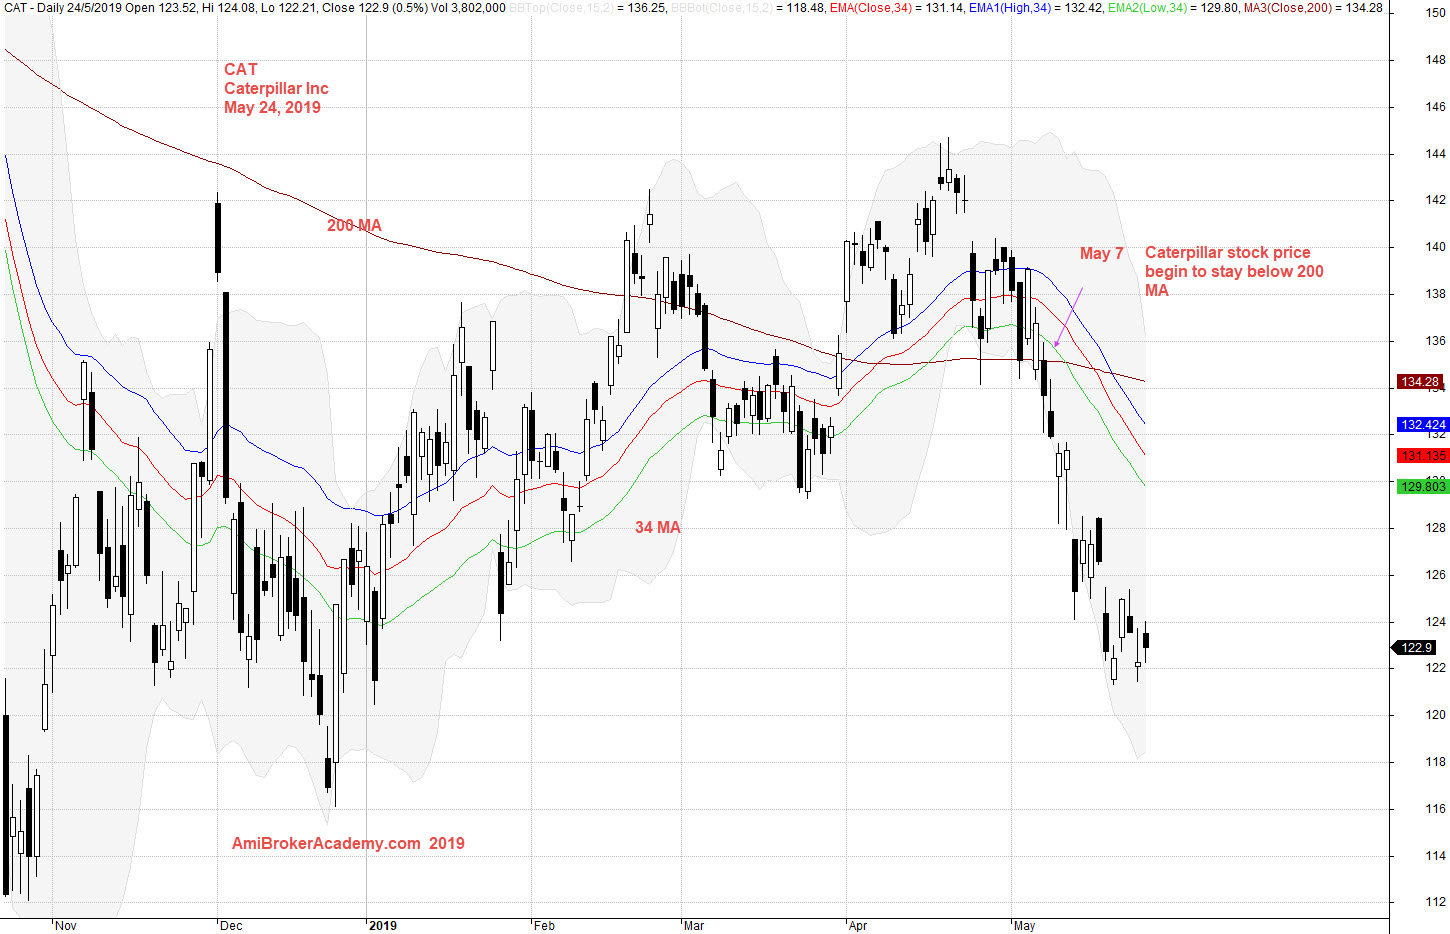
CAT Caterpillar Inc Stock Charting
Study Caterpillar Inc stock chart and River.
See chart, picture worth a thousand words.
Moving Average (MA) is a great visual tool for trend. When MA slopping up Price Action (PA) above MA, bull trend. When MA slopping down and Price Action below MA, bear trend. If Fast MA stay below Slow MA, this is also a bear trend.
From chart, we see Slow MA, 200 MA slopping down. And Fast MA, 34 MA below 200 MA, this is a bear trend.
Price Action goes from below 34 MA to above and suddenly crash below again.
Study the price action more closely, you see the price action close below 200 MA. And 34 MA has a dead cross over 200 MA. Manage your risk.
May 7 is an important date, as the China US trade dispute escalated on this date, China stock market was leading the way to decline.
Trade with your eyes open.
Moses Stock Observation
AmiBrokerAcademy.com
Disclaimer
The above result is for illustration purpose. It is not meant to be used for buy or sell decision. We do not recommend any particular stocks. If particular stocks of such are mentioned, they are meant as demonstration of Amibroker as a powerful charting software and MACD. Amibroker can program to scan the stocks for buy and sell signals.
These are script generated signals. Not all scan results are shown here. The MACD signal should use with price action. Users must understand what MACD and price action are all about before using them. If necessary you should attend a course to learn more on Technical Analysis (TA) and Moving Average Convergence Divergence, MACD.
Once again, the website does not guarantee any results or investment return based on the information and instruction you have read here. It should be used as learning aids only and if you decide to trade real money, all trading decision should be your own.