29 June 2020
Welcome to AmiBrokerAcademy.com. Thanks for visiting the site.
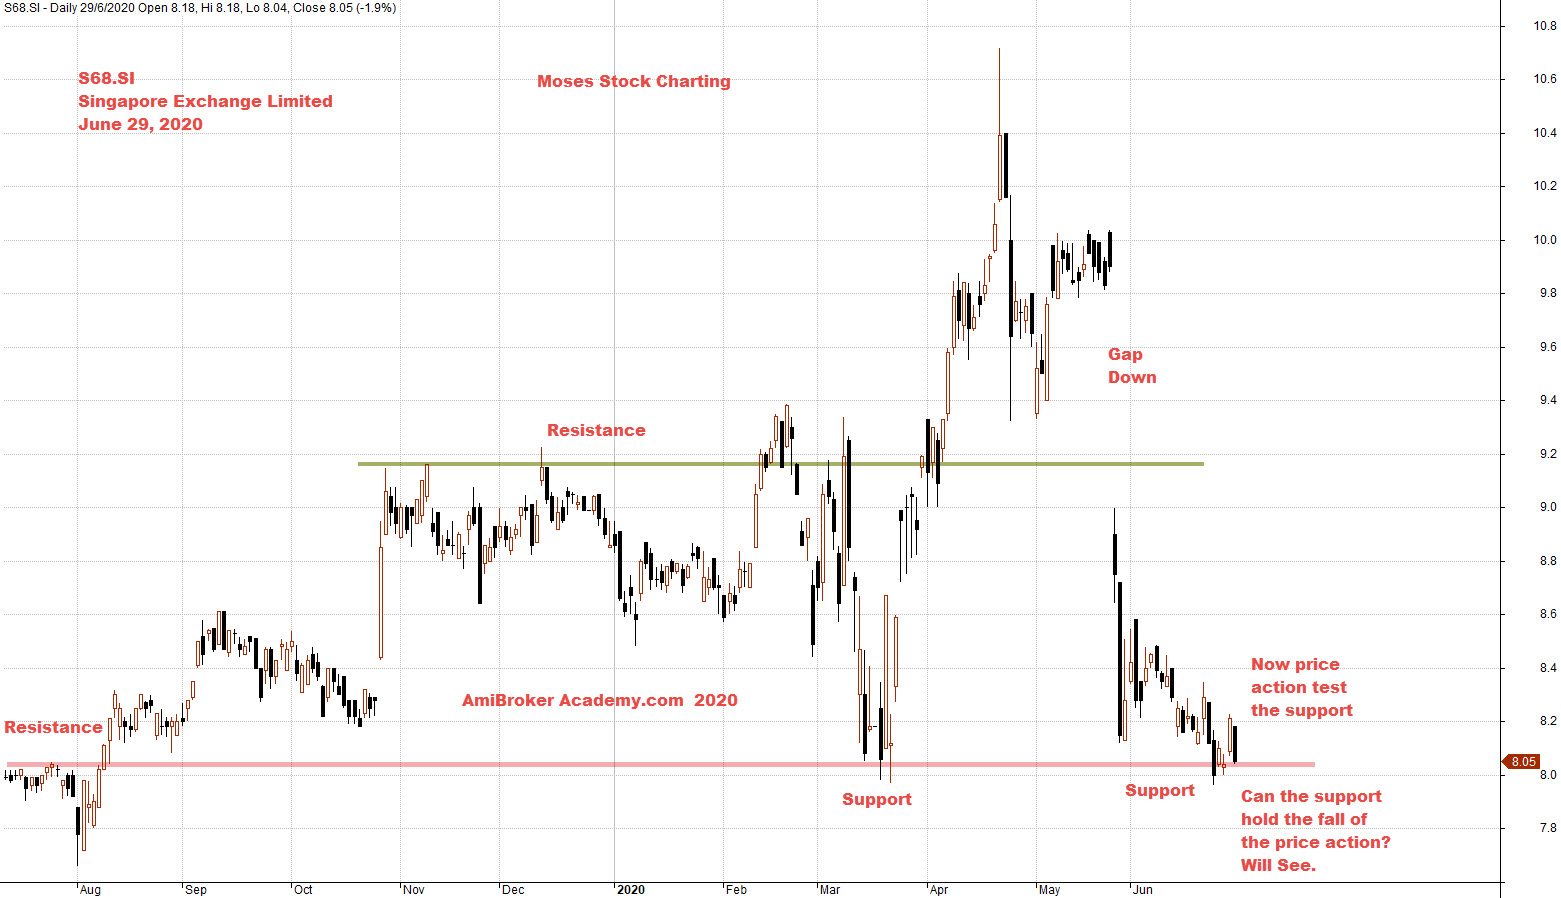
S68 Singapore Exchange Limited Stock Charting
Study Singapore Exchange Limited Stock Charting and Price Action and River.
Picture worth a thousand words. See chart.
Trade with eyes open. Mange your risk.
Price Action
Price Action moves in zigzag manner.
Support Resistance or Trendline
Buy Support Sell Resistance.
Can the Fall Stop? Stop at Eight Dollars
Will the support able to hold the fall of the price action. Will see.
Price action after tested near ten dollars eighty cents, in April, the price action struggle to hole not to breakout below nine dollars forty cents. But fail.
Price action has the big gap down, a near eighty cents gap down.
Now, the price action is try to hold it at eight dollars and five cents level. …
Moses Stock Observation
AmiBrokerAcademy.com
Disclaimer
The above result is for illustration purpose. It is not meant to be used for buy or sell decision. We do not recommend any particular stocks. If particular stocks of such are mentioned, they are meant as demonstration of Amibroker as a powerful charting software and MACD. Amibroker can program to scan the stocks for buy and sell signals.
These are script generated signals. Not all scan results are shown here. The MACD signal should use with price action. Users must understand what MACD and price action are all about before using them. If necessary you should attend a course to learn more on Technical Analysis (TA) and Moving Average Convergence Divergence, MACD.
Once again, the website does not guarantee any results or investment return based on the information and instruction you have read here. It should be used as learning aids only and if you decide to trade real money, all trading decision should be your own.