May 20, 2017
We did an analysis for Creative in March 6, this year. It was the time the stock price suddenly shoot up because of their new products. Check our analysis for details.
Singapore Stock Analysis – Stock Stories
C76 Creative Technology and Moving Averages and Bollinger Bands
Study transportation stock, C76 Creative Technology. See the chart for the stock price action. Manage your risk.
Using Moving Average and Bollinger bands to analyse the stock price.
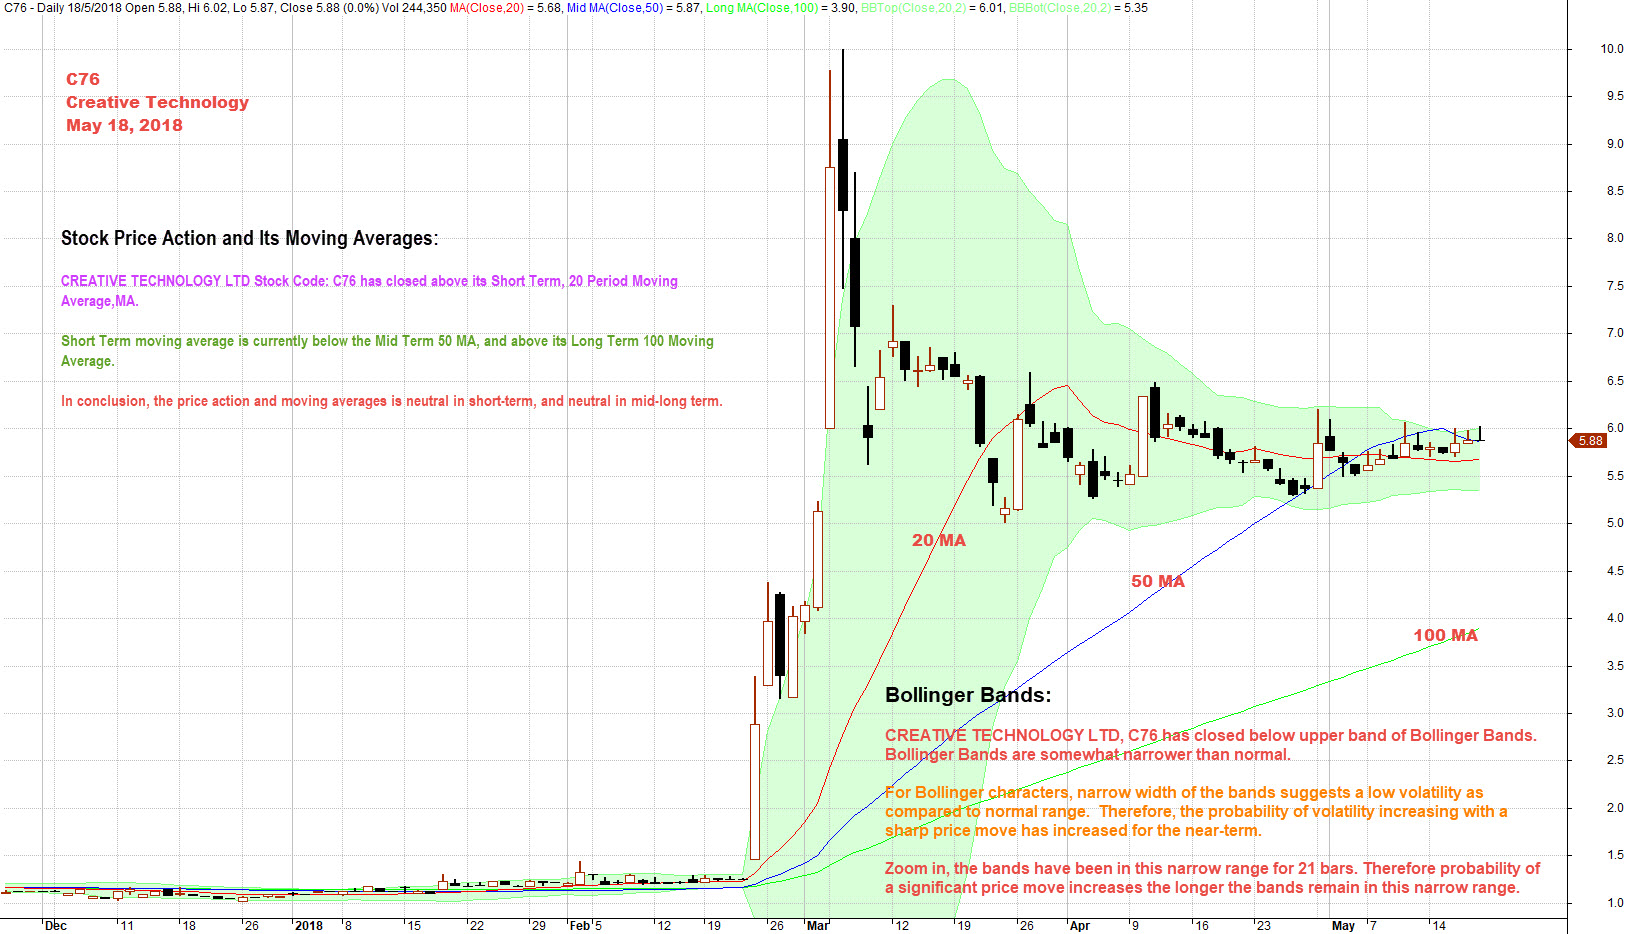
Stock Price Action and Its Moving Averages:
CREATIVE TECHNOLOGY LTD Stock Code: C76 has closed above its Short Term, 20 Period Moving Average,MA.
Short Term moving average is currently below the Mid Term 50 MA, and above its Long Term 100 Moving Average.
In conclusion, the price action and moving averages is neutral in short-term, and neutral in mid-long term.
Bollinger Bands:
CREATIVE TECHNOLOGY LTD, C76 has closed below upper band of Bollinger Bands.
Bollinger Bands are somewhat narrower than normal.
For Bollinger characters, narrow width of the bands suggests a low volatility as compared to normal range. Therefore, the probability of volatility increasing with a sharp price move has increased for the near-term.
Zoom in, the bands have been in this narrow range for 21 bars. Therefore probability of a significant price move increases the longer the bands remain in this narrow range.
Manage your risk and trade with your eyes open.
May 18, 2018 Creative Technology and Moving Averages and Bollinger Bands
Moses
AmiBrokerAcademy.com
Disclaimer
The above result is for illustration purpose. It is not meant to be used for buy or sell decision. We do not recommend any particular stocks. If particular stocks of such are mentioned, they are meant as demonstration of Amibroker as a powerful charting software and MACD. Amibroker can program to scan the stocks for buy and sell signals.
These are script generated signals. Not all scan results are shown here. The MACD signal should use with price action. Users must understand what MACD and price action are all about before using them. If necessary you should attend a course to learn more on Technical Analysis (TA) and Moving Average Convergence Divergence, MACD.
Once again, the website does not guarantee any results or investment return based on the information and instruction you have read here. It should be used as learning aids only and if you decide to trade real money, all trading decision should be your own.