21 April, 2018
Singapore Stock Analysis
C52 ComfortDelgro Corporation and MA Wave
See chart using MA, besides that add the high, low, and close of MA. You can see a “river” or “wave”. Study the Wave direction, you find the wave is pointing between one and two o’clock direction. The trend is bullish. Manage your risk.
When you look left, you will find most of the price action was below the river or wave and finally get above the river.
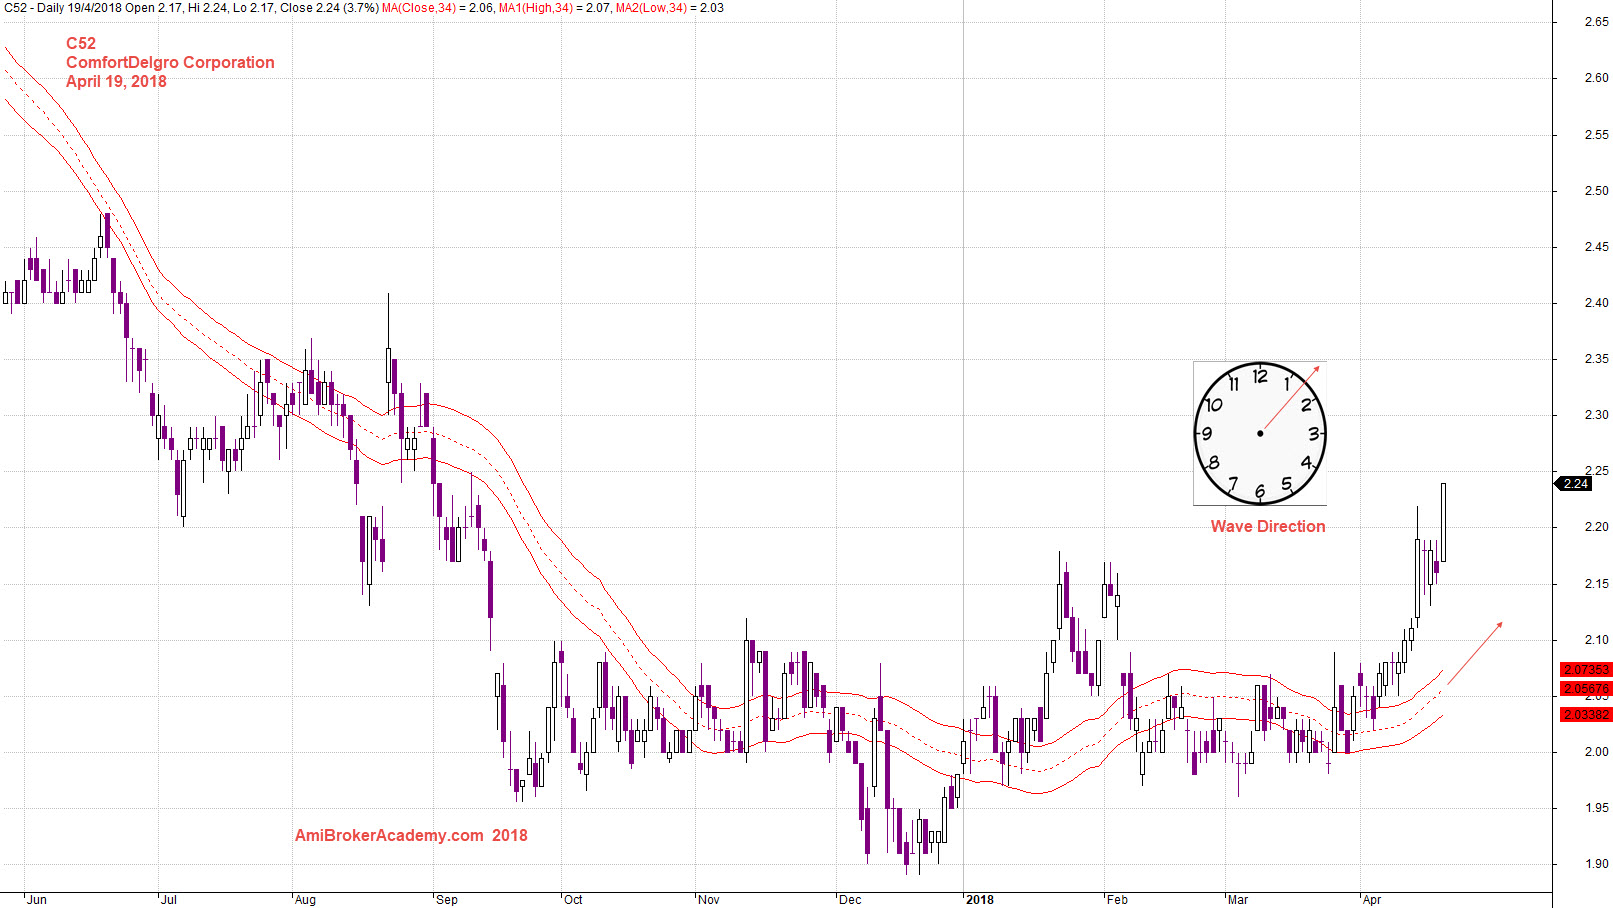
April 19, 2018 ComfortDelgro Corporation and Wave Direction
C52 ComfortDelgro Corporation and Fibonacci
Study the chart again, using Fibonacci. Swing high to low, add a Fibonacci Retracement. You can see the stock price after tested the low of 1.9, the stock price bounce up again.
Manage your risk.
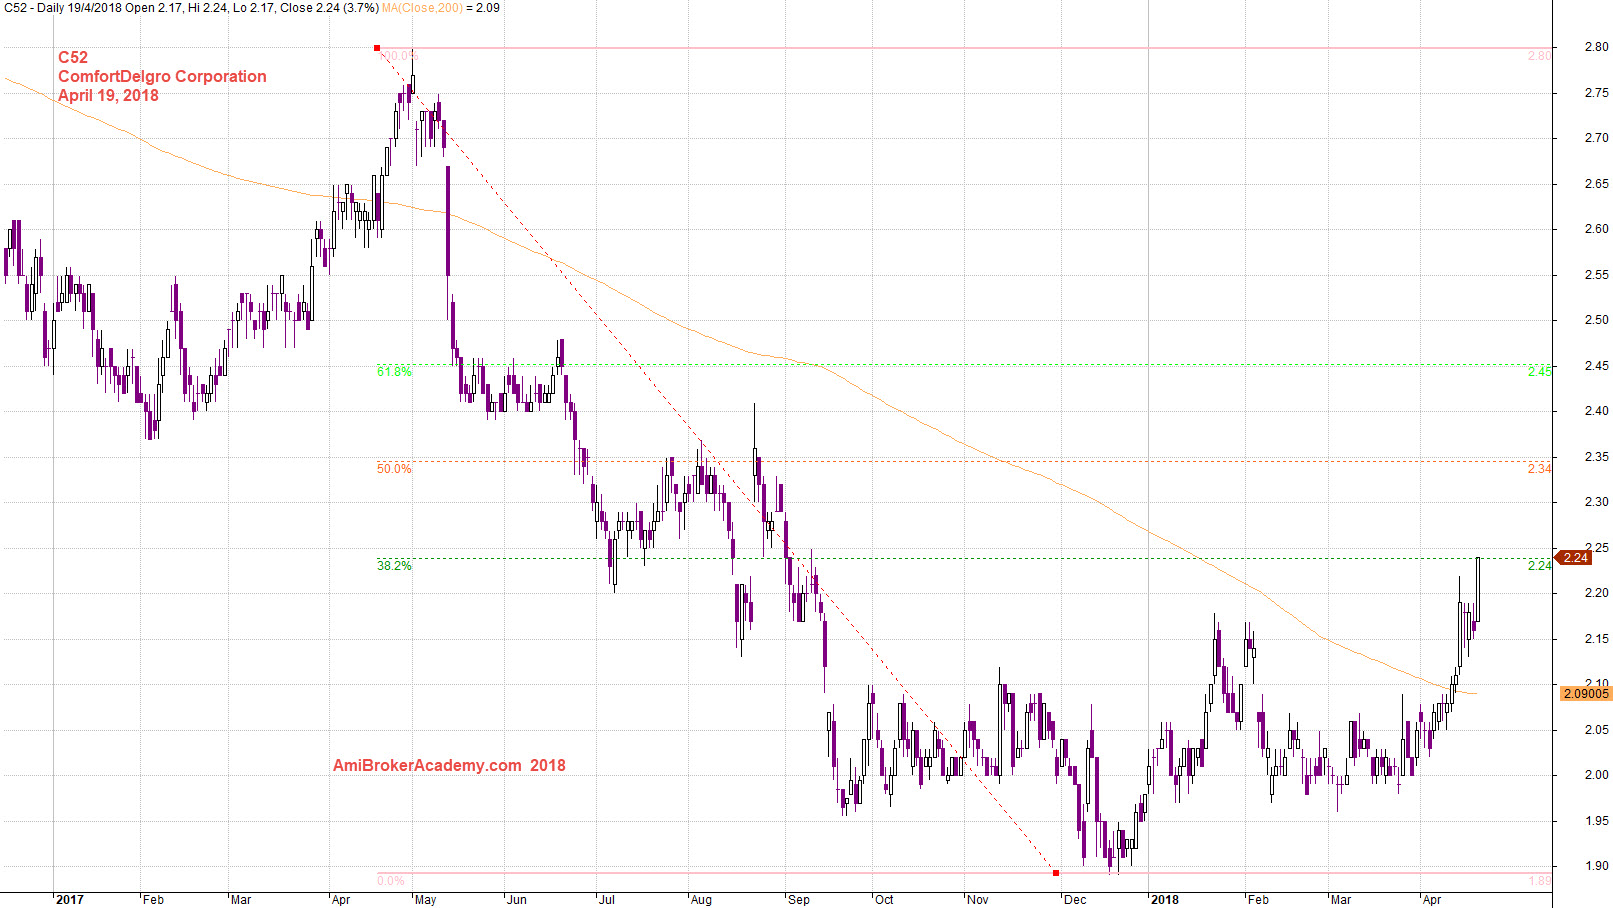
April 19, 2018 ComfortDelgro Corporation and Fibo Retracement High to Low
Moses Singapore Stock Analysis
AmiBrokerAcademy.com
Disclaimer
The above result is for illustration purpose. It is not meant to be used for buy or sell decision. We do not recommend any particular stocks. If particular stocks of such are mentioned, they are meant as demonstration of Amibroker as a powerful charting software and MACD. Amibroker can program to scan the stocks for buy and sell signals.
These are script generated signals. Not all scan results are shown here. The MACD signal should use with price action. Users must understand what MACD and price action are all about before using them. If necessary you should attend a course to learn more on Technical Analysis (TA) and Moving Average Convergence Divergence, MACD.
Once again, the website does not guarantee any results or investment return based on the information and instruction you have read here. It should be used as learning aids only and if you decide to trade real money, all trading decision should be your own.