5 December 2021
Welcome!
Welcome to AmiBroker Academy dot com, amibrokeracademy.com.
If There is Only One Chart This is It
This is not a site that provides buy or sell signals directly. We read the stock chart bar by bar. If you understand what we read, you will get the buy or sell idea. Have fun!
Buy or Sell, you decide
Trading is very simple yet very difficult. Price is either up or down. But catch the right move is not easy. I believe many must have missed the falling knife. Now, many will be watching the topping. Can any catch the topping? Will see.
Up Down or Sideways
Trading is all probability. The price action is either up, down or sideways.
Trade what you see. Manage your risk.
Our Believe – Buy Support Sell Resistance.
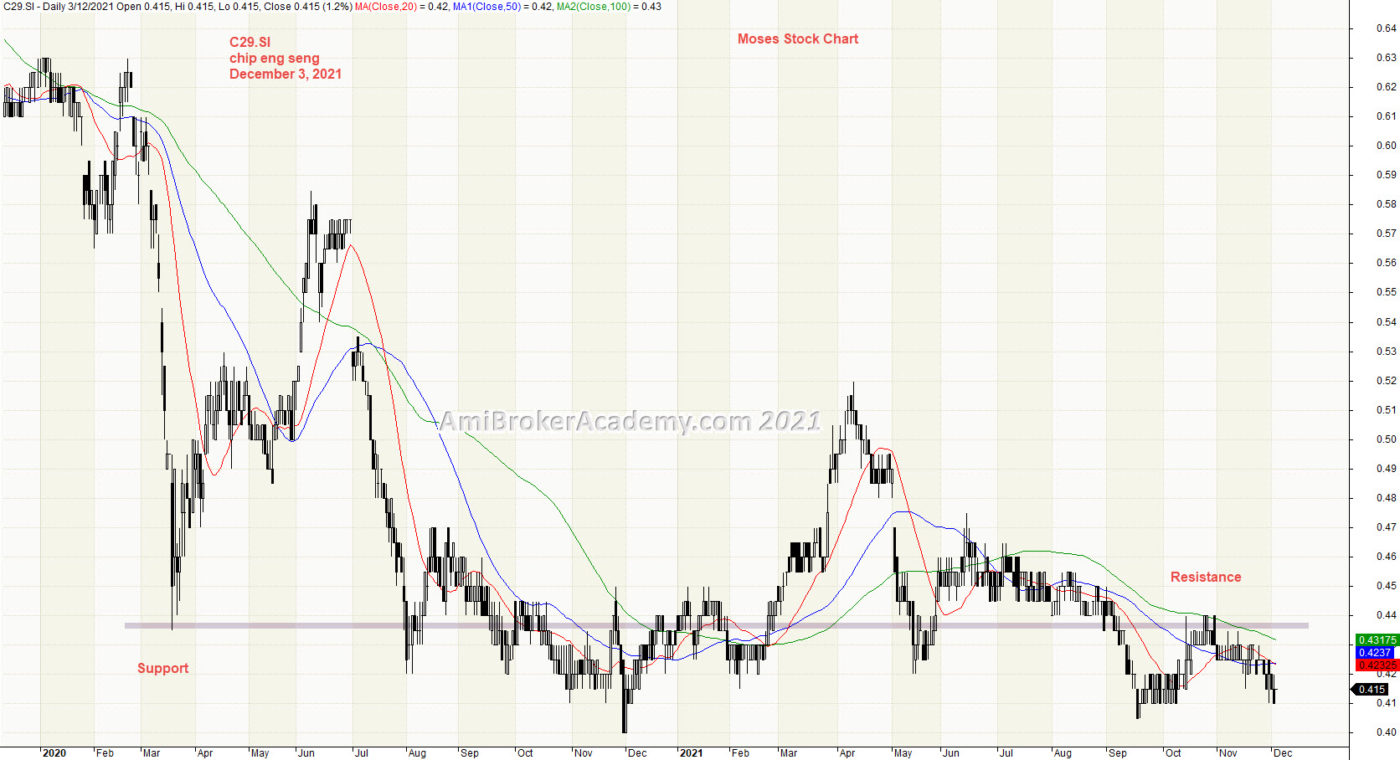
1) Chip Eng Seng C29
Picture worth a thousand words. Zoom out and see a bigger picture. Price Action fall like a falling knife from start of 2020. But quickly the price action regain energy and bounce up. But fail again. Some of you may say why can’t the price action return to the same high again. Sure can. But the business will be all different. You have to understand, the term recovery is only a phrase. The true is the revenue are all new. Price Action has continue to go lower after try to gain the high. Now the price Action is below the support turns resistance.
We did a zoom in analysis, please check it out.
See chart.
Moses Power Charting
Official AmiBrokerAcademy.com Charting
Disclaimer
The above result is for illustration purpose. It is meant to be used for learning buy or sell signals. We do not recommend for any particular stocks. If particular stocks of such are mentioned, they are meant as a demonstration of Amibroker as a powerful charting software. Amibroker is a charting software, it can program to scan the stocks for buy and sell signals. Or backtest for any trading strategy or technique.
We post script generated signals. Not all scan results are shown here depending on selection criterial. The MACD signal should use with price action. Users must understand what MACD and price action are all about before using them. If necessary you should attend a course to learn more on Technical Analysis (TA) and Moving Average Convergence Divergence, MACD.
Once again, the website does not guarantee any results or investment return based on the information and instruction you have read here. It should be used as learning aids only and if you decide to trade real money, all trading decision should be your own.
We learn from many past and present great traders. Kudo to these master.