28 May, 2018
US Stock Chart Analysis
BX The Blackstone Group Charting Before 2008
Picture worth a thousand words, see chart on The Blackstone Group. The stock price went from the low in 2009 to the high at 2015. The price action has fall from 44 to now near 32. From the chart, the price has reverse but still quite far from the peak. Trade with eyes open.
Manage your risk!
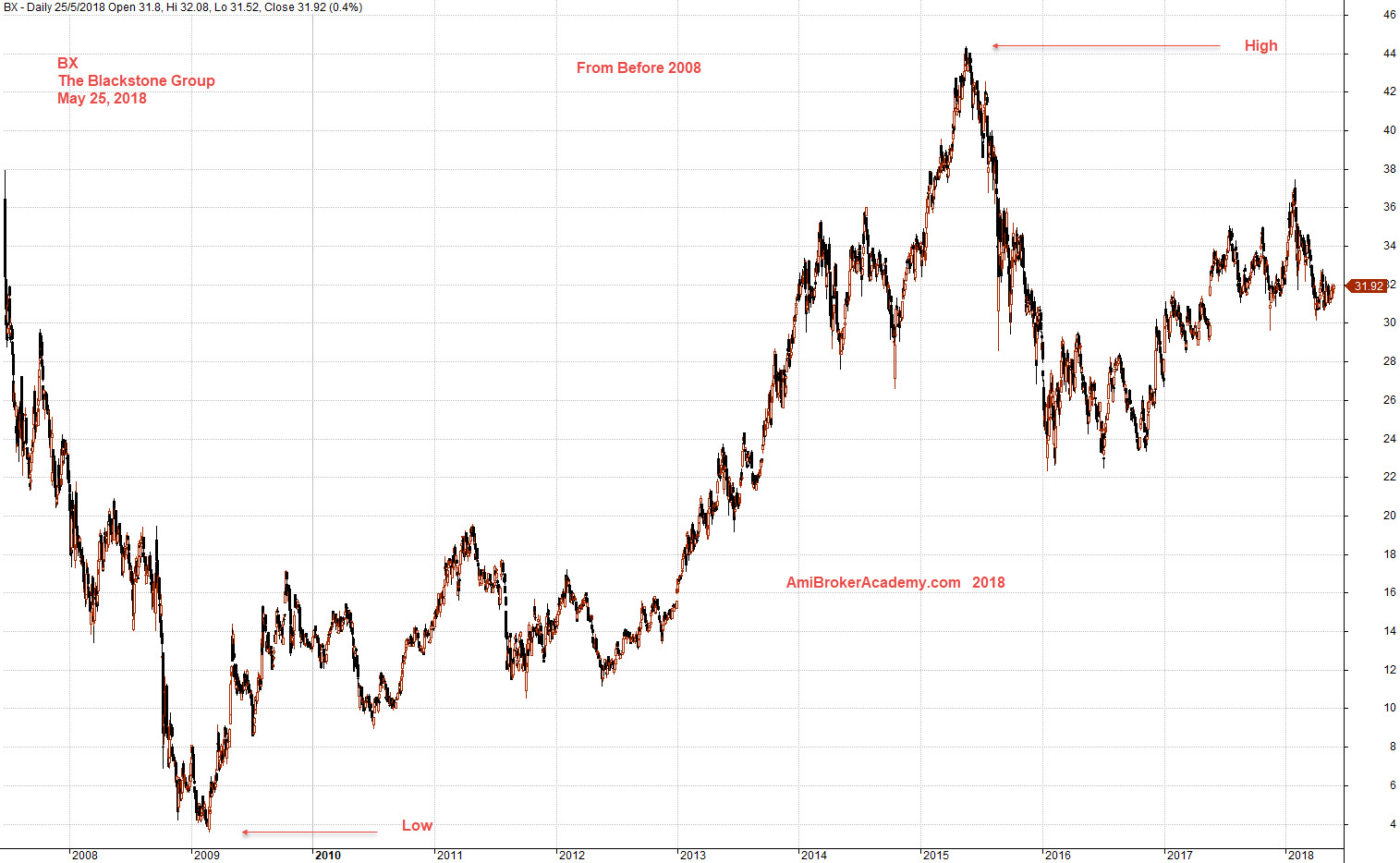
May 25, 2018 The Blackstone Group from Before 2008
BX The Blackstone Group Charting and Support Resistance
Study The Blackstone Group stock price using quarter support resistance. We can see the stock price went from bullish to bearish to sideways. Again the year support resistance provide a picture of the stock volatility. 2016 and 2017 has a similar volatility, beside we see the trend become bullish compare 2017 to 2016, bullish compare 2018 to 2017. Picture worth a thousand words, see chart.
Manage your risk
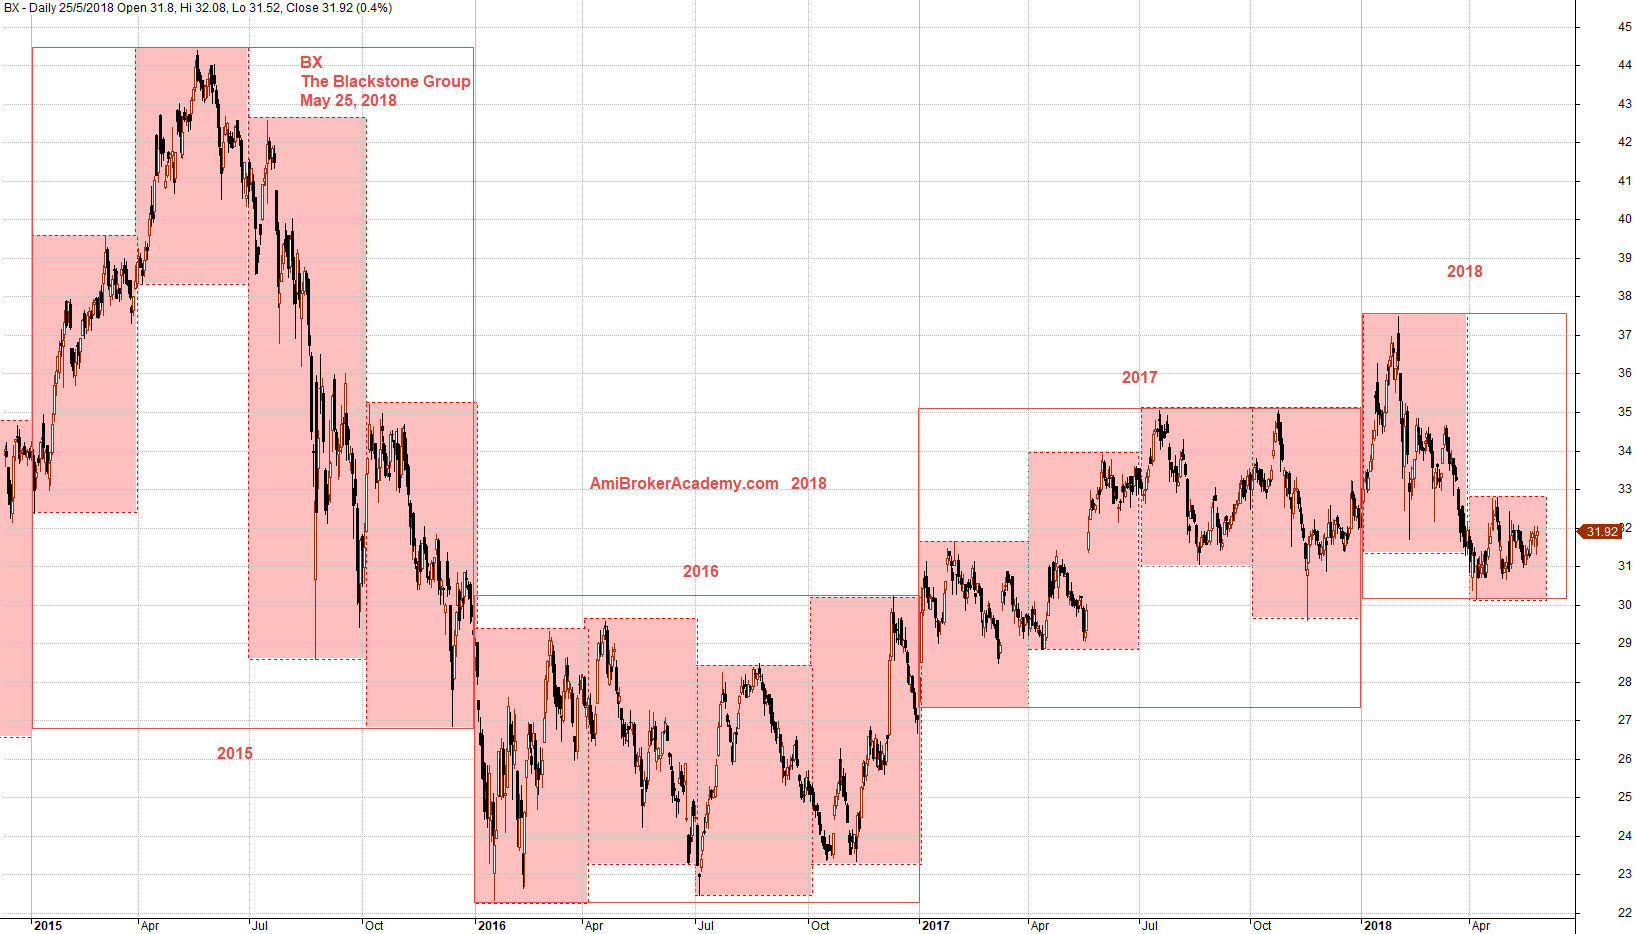
May 25, 2018 The Blackstone Group and Support Resistance
Moses US Stock Chart Analysis
AmiBrokerAcademy.com
Disclaimer
The above result is for illustration purpose. It is not meant to be used for buy or sell decision. We do not recommend any particular stocks. If particular stocks of such are mentioned, they are meant as demonstration of Amibroker as a powerful charting software and MACD. Amibroker can program to scan the stocks for buy and sell signals.
These are script generated signals. Not all scan results are shown here. The MACD signal should use with price action. Users must understand what MACD and price action are all about before using them. If necessary you should attend a course to learn more on Technical Analysis (TA) and Moving Average Convergence Divergence, MACD.
Once again, the website does not guarantee any results or investment return based on the information and instruction you have read here. It should be used as learning aids only and if you decide to trade real money, all trading decision should be your own.