17 September, 2018
Thanks for visiting the site.
TSLA Tesla Inc Charting
Buy Support Sell Resistance or Buy Low Sell High
Study chart of Tesla Inc stock price. Apply buy support and sell resistance strategy, see chart picture worth a thousand words, where is the support, where is the resistance.
Stock price almost there near 400, but the price action become very volatile. See chart, picture worth a thousand words. We see a bull ABCD, push the price up to near 400 dollars, but this is a sell ABCD pattern. So, the next move, the price action completed a bear ABCD, bring the price action down to 240 dollars. So, respect H M Gartley observation, to under stand more. You can read his book on Profits in the Stock Market or Larry Peseventto’s Fibonacci Ratios with Pattern Recognition.
Remind you again, buy support and sell resistance. Trade with eyes open.
Manage your risk.
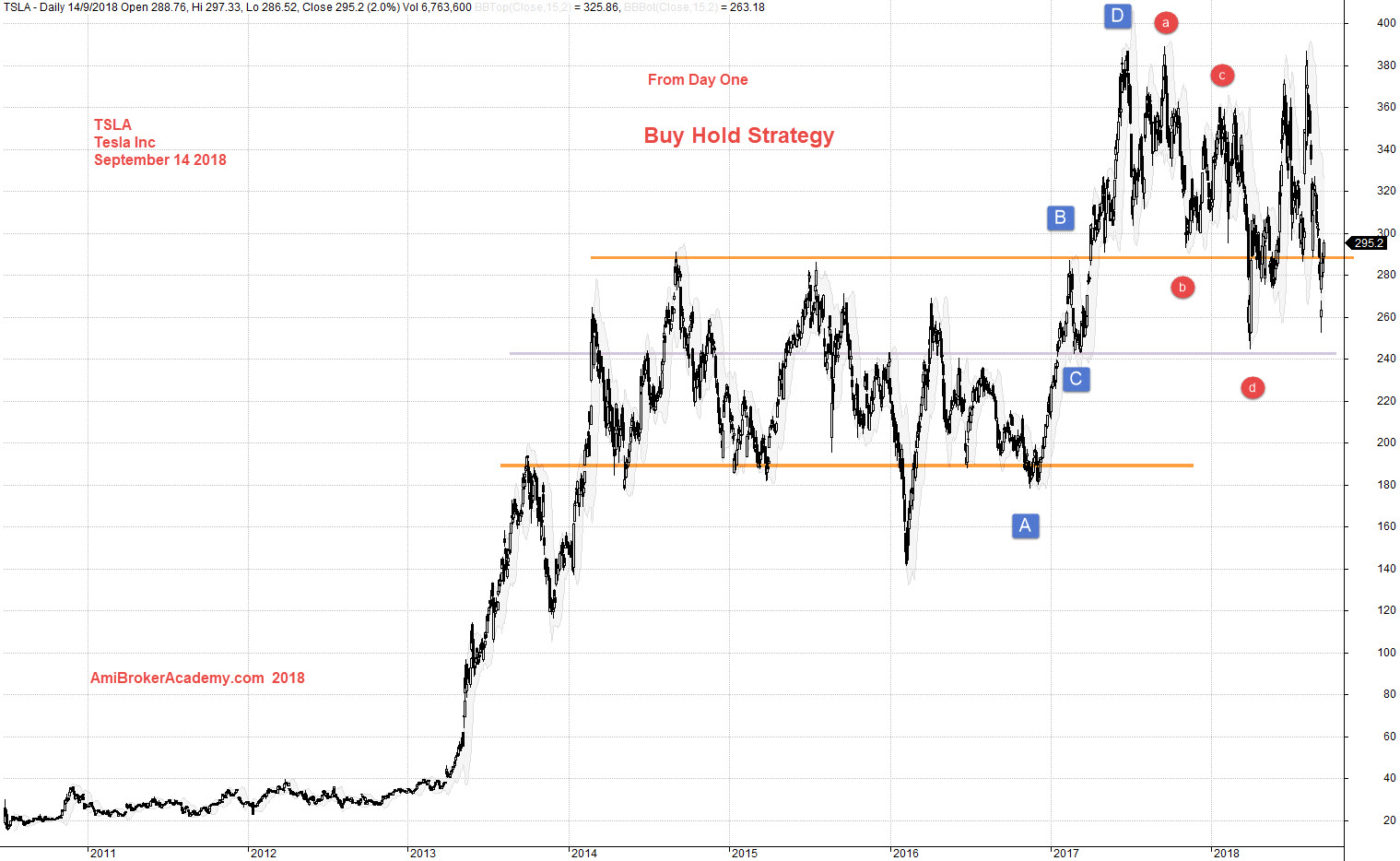
September 14, 2018 Tesla Inc from Day One Buy Hold Strategy
If you can see the full chart, “press Ctrl and -” to zoom out and see the entire chart.
Zoom in, and you see the price action are very very volatile. See chart. As said, buy support and sell resistance. Trade with what you see and not what you think, trade with eyes open. Manage your risk.
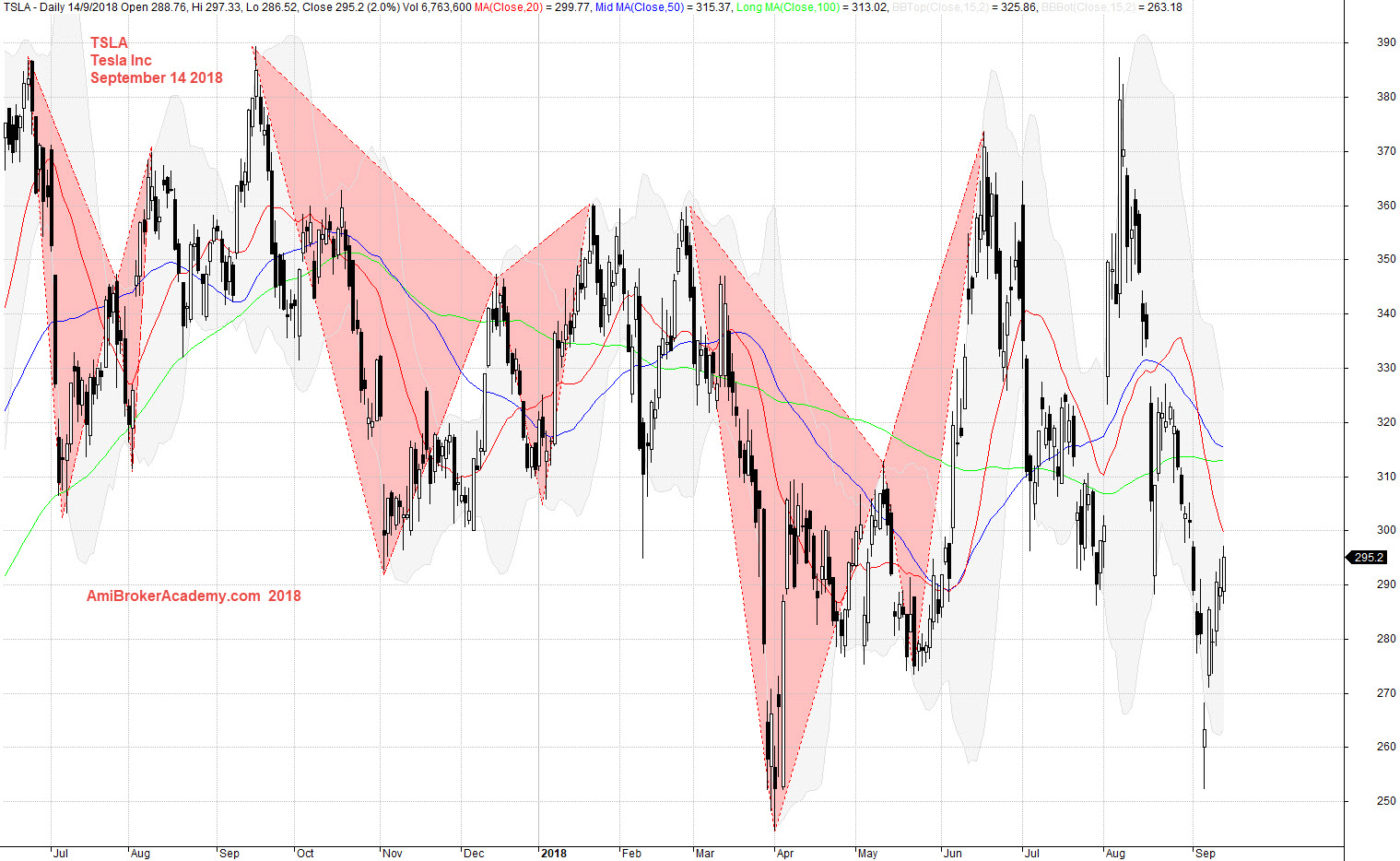
September 14, 2018 Tesla Inc Butterfly
If you can see the full chart, “press Ctrl and -” to zoom out and see the entire chart.
Read the chart from a different perspective. You see a bull channel. So, trade from low band channel to top band channel. This is another form of buy support sell resistance. Trade with eyes open. Manage your risk.
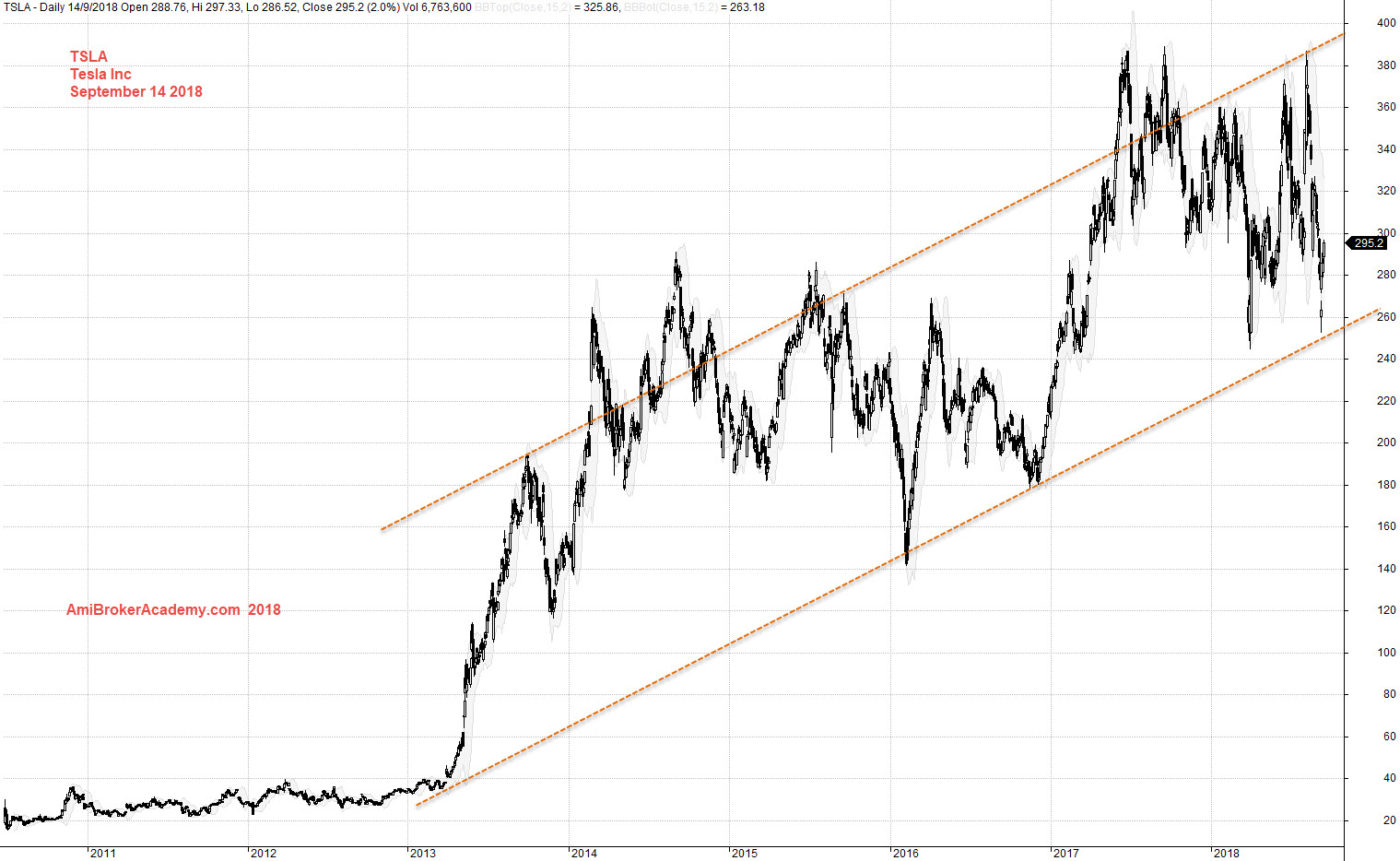
September 14, 2018 Tesla Inc Bull Channel
Moses US Stock Chart Analysis
AmiBrokerAcademy.com
Disclaimer
The above result is for illustration purpose. It is not meant to be used for buy or sell decision. We do not recommend any particular stocks. If particular stocks of such are mentioned, they are meant as demonstration of Amibroker as a powerful charting software and MACD. Amibroker can program to scan the stocks for buy and sell signals.
These are script generated signals. Not all scan results are shown here. The MACD signal should use with price action. Users must understand what MACD and price action are all about before using them. If necessary you should attend a course to learn more on Technical Analysis (TA) and Moving Average Convergence Divergence, MACD.
Once again, the website does not guarantee any results or investment return based on the information and instruction you have read here. It should be used as learning aids only and if you decide to trade real money, all trading decision should be your own.