14 September 2018
What is the ‘Gartley Pattern’
Back in 1932 H M Gartley laid down a chart pattern in his book, Profits in the Stock Market, page 222. See below the chart.
Gartley Patterns
The H M Gartley pattern becomes complex chart pattern, when added Fibonacci numbers and ratios. But this helps traders identify reaction highs and lows. The H M Gartley pattern is the most commonly used harmonic chart pattern.
To understand better, you can read Larry Pesavento’s book Fibonacci Ratios with Pattern Recognition. Larry applied Fibonacci ratios to the pattern.
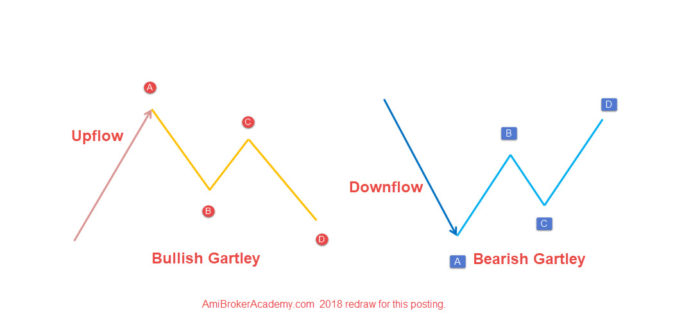
Price action are moving in zigzag manner, when you study carefully you could see the Gartley pattern, ABCD or 1234. The perfect Gartley pattern AB=CD.
In Our Last Posting …
We told you in our last posting, market having a weak heart. Why? We see bullish Gartley pattern in Straits Times Index, in OCBC stock, and …
Let’s study DBS stock and see what happen.
Singapore Stock Stories
Thanks for visiting the site.
D05 DBS Group Holdings DBS Charting
Study Support Resistance
To maximize your profit and minimize risk is to buy low sell high, or in other words, buy support sell resistance.
Study DBS Group Holdings stock price. Use buy support sell resistance strategy. Remember to take profit when the price action breakout below the bullish trend line. See chart picture worth a thousand words.
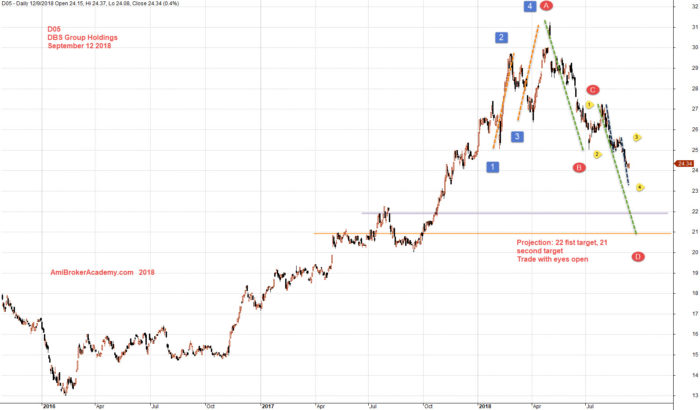
Stock price after breakout 31 dollars and begin to fail. The price action moves in a very clear and nice H M Gartley ABCD, a bearish ABCD pattern. The projection of the cd leg may end below 22 dollars. See chart picture worth a thousand words.
Trade with eyes open.
Manage your risk.
September 12, 2018 DBS Group Holdings Projection
Zoom out, we see the price action breakout the resistance and climb to the high of 31 dollars. Now the price action pullback. It is likely the price may touch the resistance again. What the price be? May be near 21. Trade with your eyes open.
Upflow, ABCD, bullish Gartley Bullish pattern. See chart, picture worth a thousand words. We may be prepare to re-enter the market near 21 region. Trade with eyes open. Of course, all setup can fail.
Manage your risk.
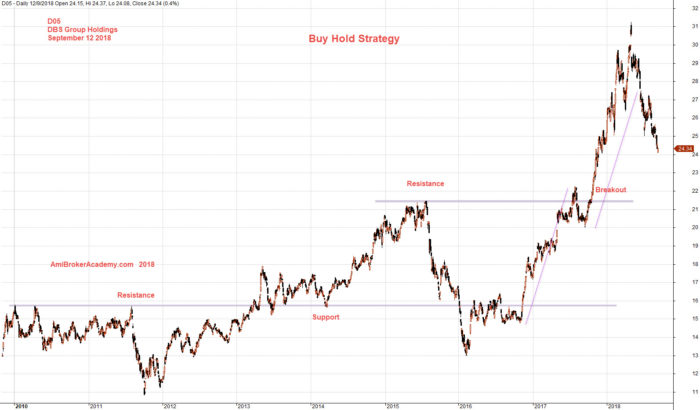
September 12, 2018 DBS Group Holdings Buy Hold Strategy
See chart, with MACD indicator. MACD signal is below zeroline, bearish bias.
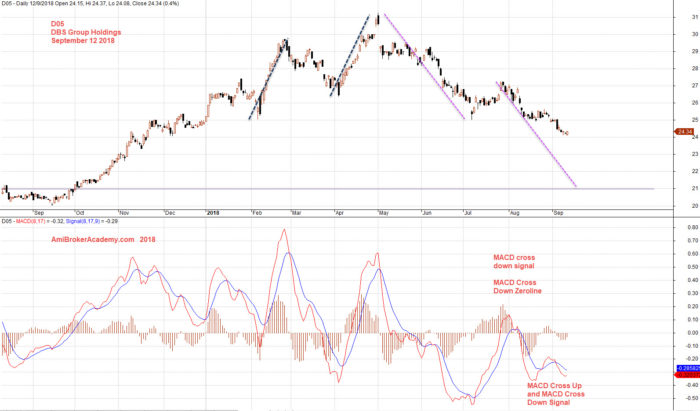
September 12, 2018 DBS Group Holdings and MACD
Moses
AmiBrokerAcademy.com – we are different
Disclaimer
The above result is for illustration purpose. It is not meant to be used for buy or sell decision. We do not recommend any particular stocks. If particular stocks of such are mentioned, they are meant as demonstration of Amibroker as a powerful charting software and MACD. Amibroker can program to scan the stocks for buy and sell signals.
These are script generated signals. Not all scan results are shown here. The MACD signal should use with price action. Users must understand what MACD and price action are all about before using them. If necessary you should attend a course to learn more on Technical Analysis (TA) and Moving Average Convergence Divergence, MACD.
Once again, the website does not guarantee any results or investment return based on the information and instruction you have read here. It should be used as learning aids only and if you decide to trade real money, all trading decision should be your own.