3 July, 2018
Thanks for visiting the site.
Moses Stock Chart Analysis
^AORD Australian All Ordinaries Index Stock Charting
Study the stock chart of Australia All Ordinaries Index, from the box we added we see a breakout and a slight pullback. Is it a breakout or the trapped setup? Don’t know. At least we can not tell at this point in time.
From the indicator we added, MACD indicator. We see a divergence. It signals a possible trend change, may be a small one. So to play safe, let the price action to shows hand. Wait.
Manage your risk.
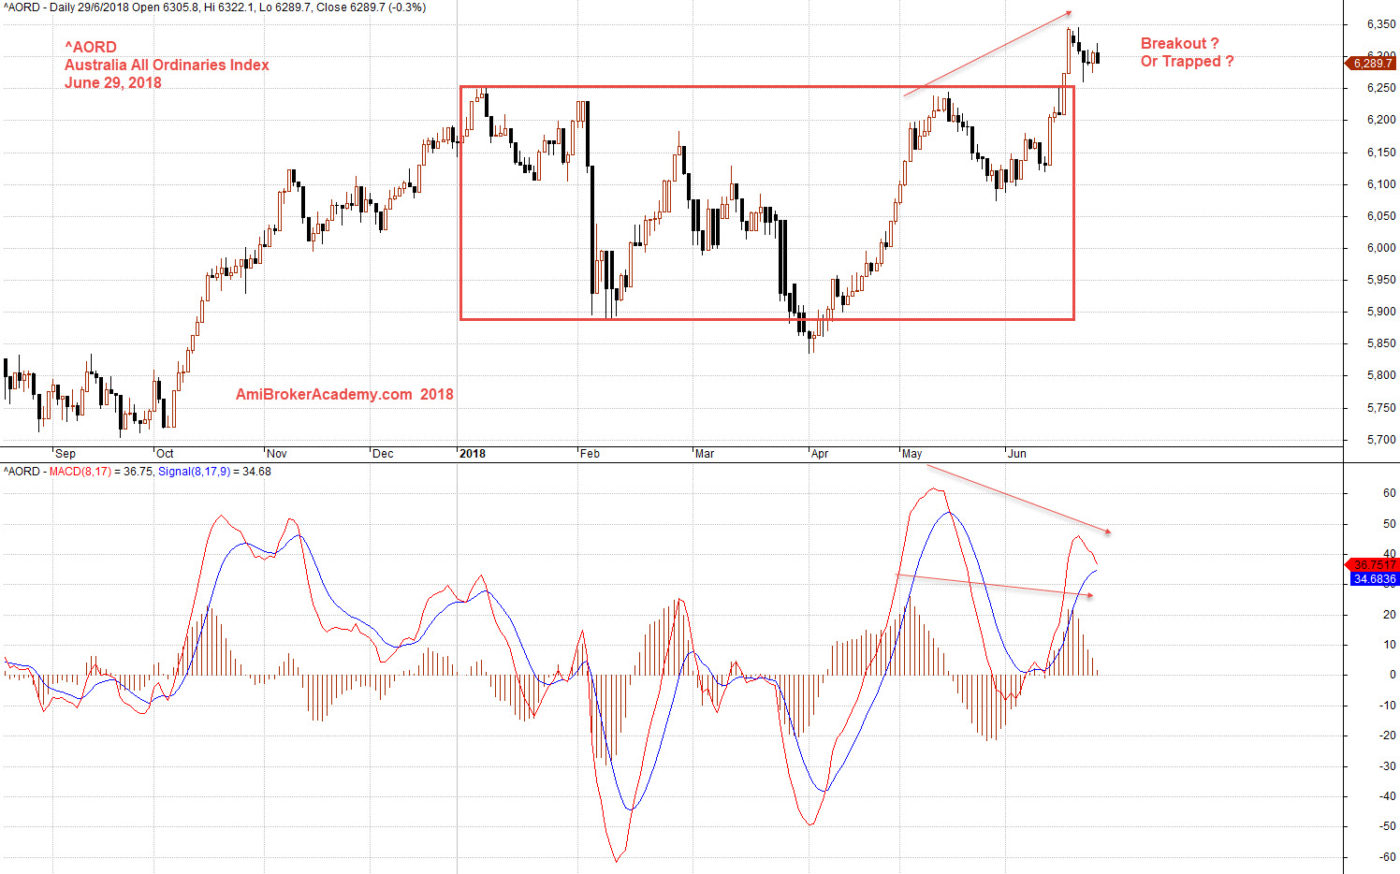
June 29, 2018 Australia All Ordinaries Index and MACD
Australia – Land Down Under
Moses Stock Chart Analysis
AmiBrokerAcademy.com
Disclaimer
The above result is for illustration purpose. It is not meant to be used for buy or sell decision. We do not recommend any particular stocks. If particular stocks of such are mentioned, they are meant as demonstration of Amibroker as a powerful charting software and MACD. Amibroker can program to scan the stocks for buy and sell signals.
These are script generated signals. Not all scan results are shown here. The MACD signal should use with price action. Users must understand what MACD and price action are all about before using them. If necessary you should attend a course to learn more on Technical Analysis (TA) and Moving Average Convergence Divergence, MACD.
Once again, the website does not guarantee any results or investment return based on the information and instruction you have read here. It should be used as learning aids only and if you decide to trade real money, all trading decision should be your own.