April 26, 2019
Thanks for visit the site here. Hope you find the read interesting.
Think think got more things.
Once in a while we will give you a full insight of many of our charting here. For the last fifty posts. We just post the chart with some information on the chart and comment. Now read this long posting for fun!
As we ask to your check for new posting on how to enter the big move. See the strategy we use to apply. Of course this is not the only approach we have. It is all driven by the price action on the chart.
Oh yes! If you happen to be new here. Our regular reader will know, all set up can fail. And only until it fail, otherwise the setup is remain correct.
Remember there is no sure win business. See many of the big company after many years still change owner, why? No sure win product, no sure win strategy. All product can fail, all set up can fail. Manage your own risk and have a plan B. Have fun!
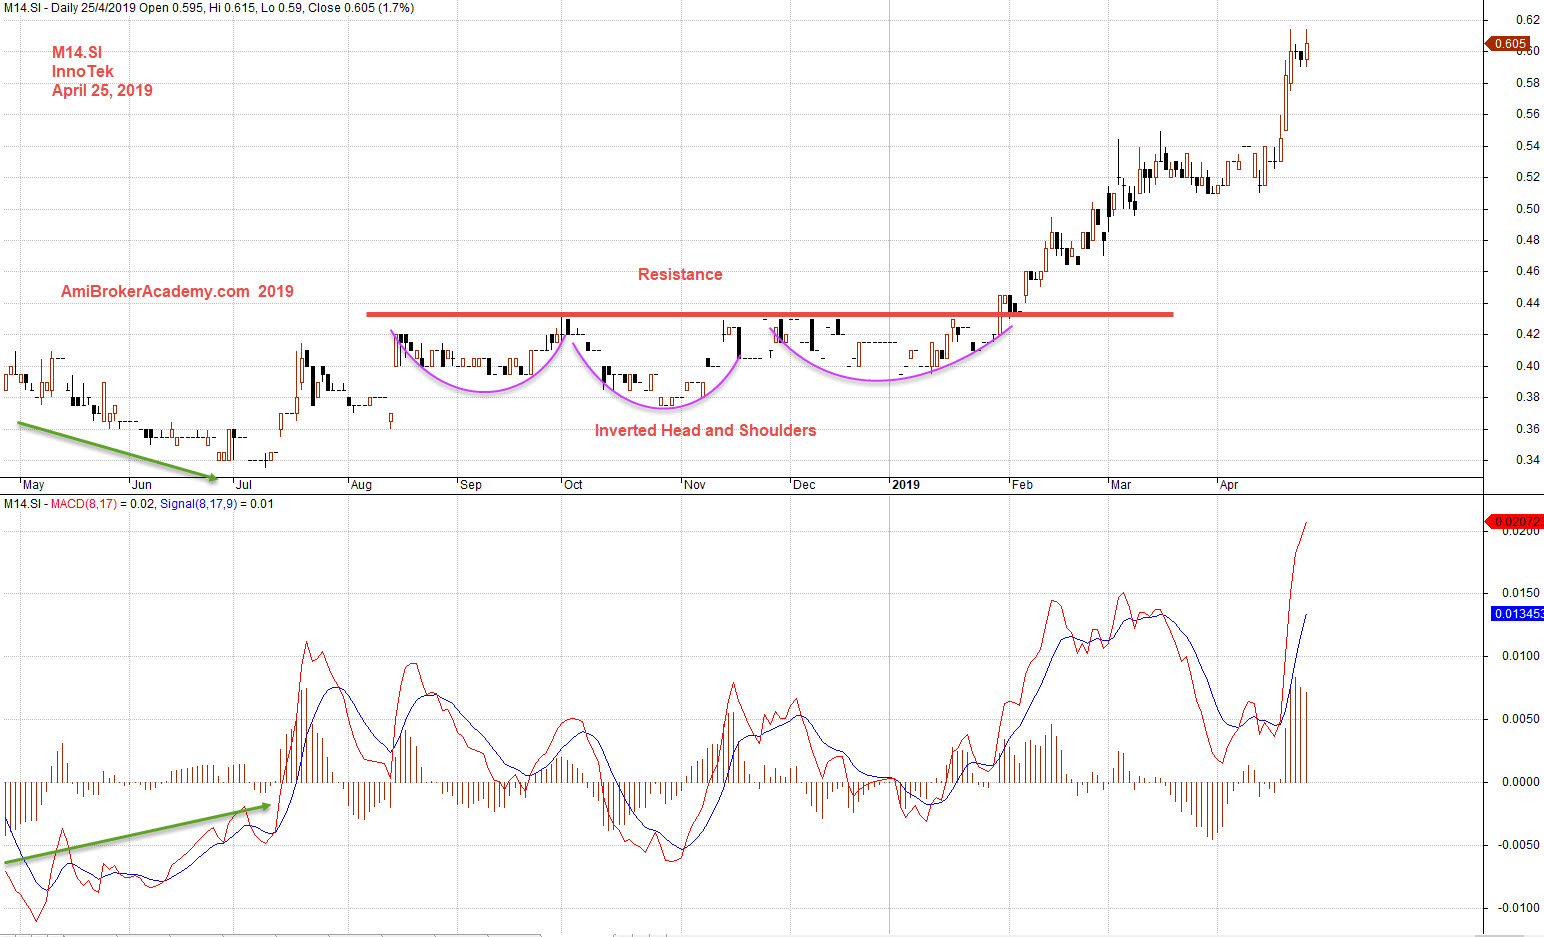
M14.SI InnoTek Stock Charting
Study InnoTek Stock chart and MACD
See chart, picture worth a thousand words.
Many guru out there tell you do not use indicator. But it all depend, depend on which indicator, next depending how you use them.
MACD is a leading indicator. MACD signal you there is possibility of price action changing direction. Just like traffic light, what are they for? To signal you to stop. But do not stop in every traffic light. No, right? This is also through for MACD. MACD indicator is just like traffic light, it signal you that price action is about to change direction. Do there change immediately? No.
See the chart below for more.
MACD indicator provides a positive MACD-H divergence signal; price goes lower but MACD-H form higher low. We are out sporting for a reversal. Price action has the pattern on confirm the change. See an inverted head and shoulders to confirm the reversal. Price action finally breakout from the resistance, or neckline.
Trade with eyes open.
If you miss the big picture posting, see the link here. ABCD Patterns | H M Gartley | M14 | InnoTek | Moses Stock Charting | AmiBrokerAcademy.com
Moses Stock Chart Analysis
AmiBrokerAcademy.com
Disclaimer
The above result is for illustration purpose. It is not meant to be used for buy or sell decision. We do not recommend any particular stocks. If particular stocks of such are mentioned, they are meant as demonstration of Amibroker as a powerful charting software and MACD. Amibroker can program to scan the stocks for buy and sell signals.
These are script generated signals. Not all scan results are shown here. The MACD signal should use with price action. Users must understand what MACD and price action are all about before using them. If necessary you should attend a course to learn more on Technical Analysis (TA) and Moving Average Convergence Divergence, MACD.
Once again, the website does not guarantee any results or investment return based on the information and instruction you have read here. It should be used as learning aids only and if you decide to trade real money, all trading decision should be your own.