16 January 2019
Welcome to AmiBrokerAcademy.com. We provide US stock analysis for academy learning.
Think!
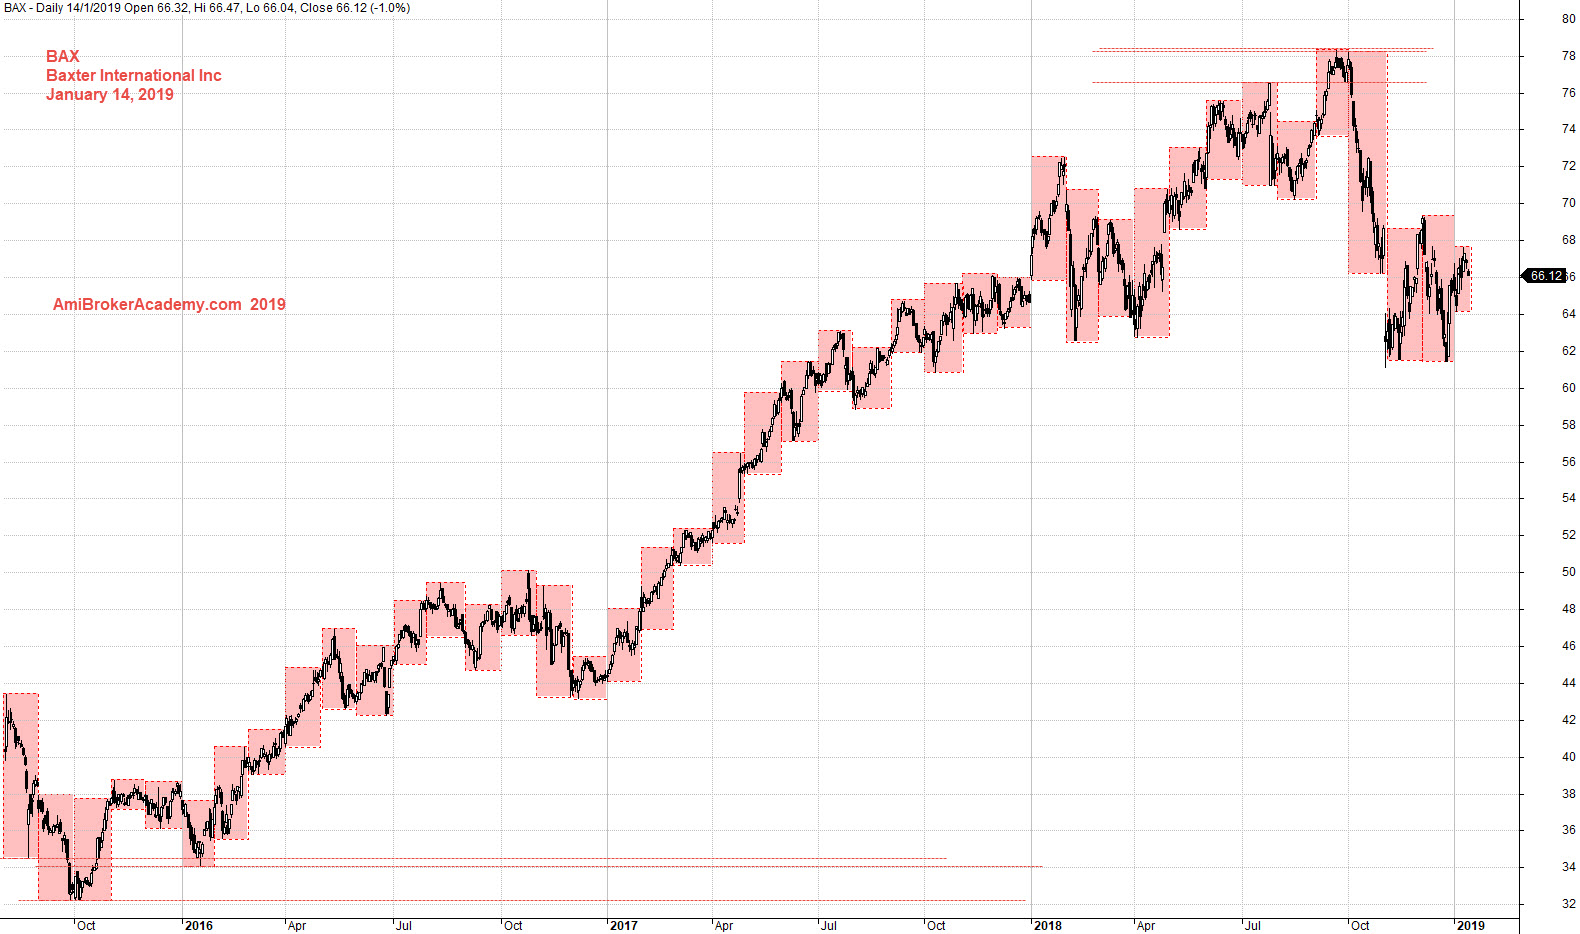
BAX Baxter International Inc Stock Charting
Study Baxter International stock chart using month high and low. We could see the price action staging up and down. The price action finally got resisted by the ceiling. The price action stop going any higher.
Trade with eyes open.
Add 34 period moving average, high low and close and 200 period moving average. We see price action after hit the peak at 78 dollars, the price action close below MA and stay below. Bearish bias.
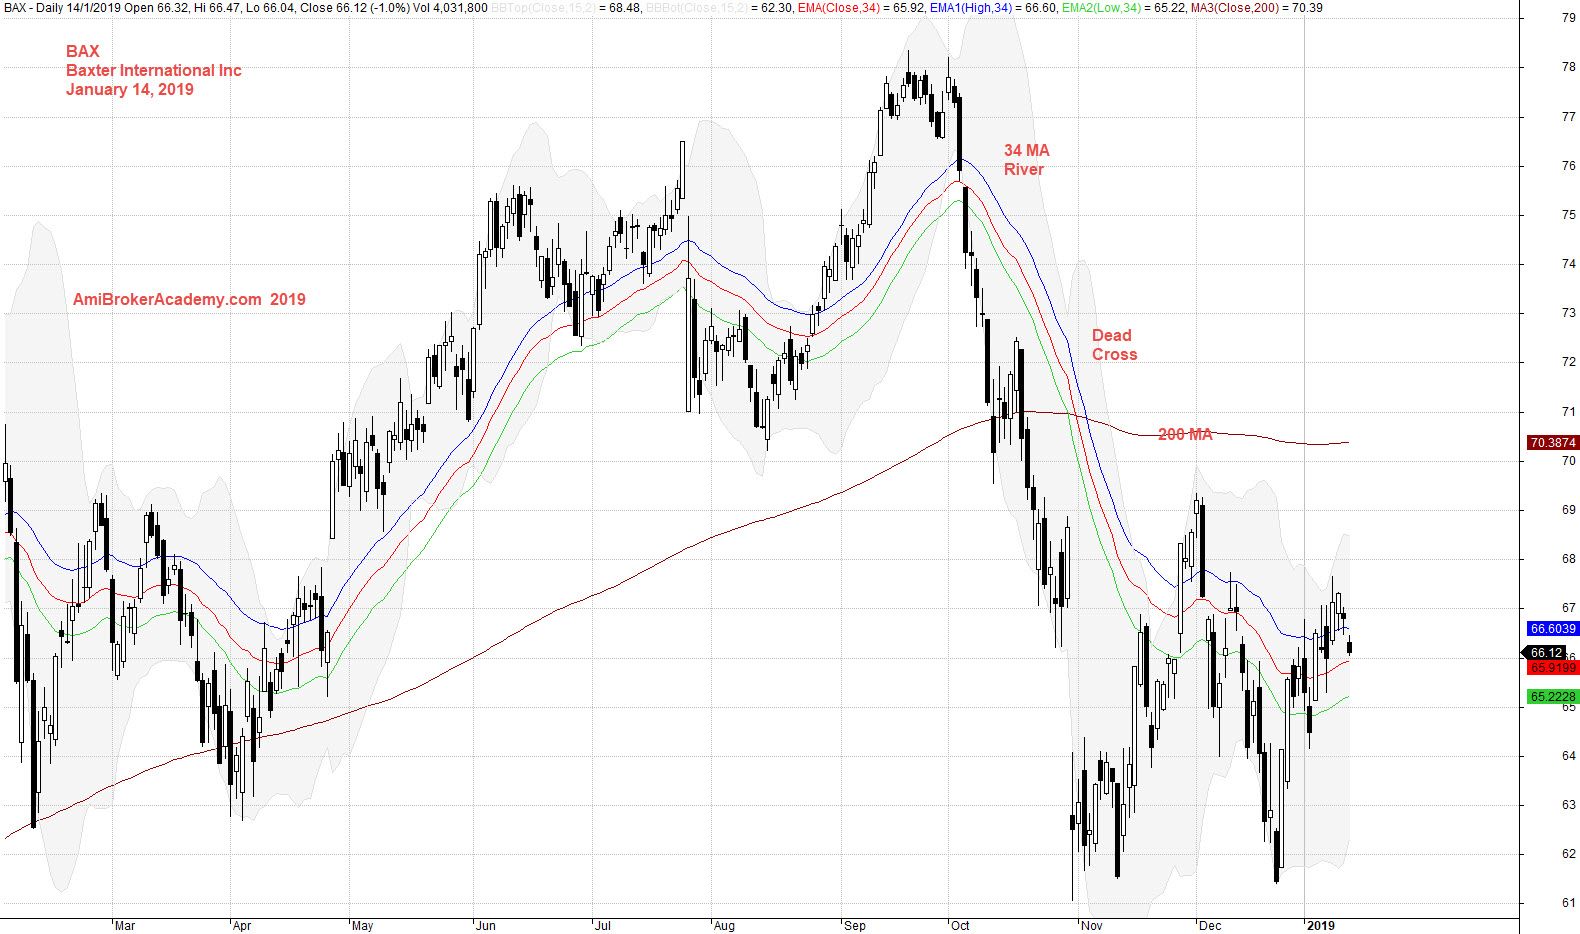
January 14, 2019 Baxter International Inc and River
Moses Stock Analysis
AmiBrokerAcademy.com
Disclaimer
The above result is for illustration purpose. It is not meant to be used for buy or sell decision. We do not recommend any particular stocks. If particular stocks of such are mentioned, they are meant as demonstration of Amibroker as a powerful charting software and MACD. Amibroker can program to scan the stocks for buy and sell signals.
These are script generated signals. Not all scan results are shown here. The MACD signal should use with price action. Users must understand what MACD and price action are all about before using them. If necessary you should attend a course to learn more on Technical Analysis (TA) and Moving Average Convergence Divergence, MACD.
Once again, the website does not guarantee any results or investment return based on the information and instruction you have read here. It should be used as learning aids only and if you decide to trade real money, all trading decision should be your own.