31 March 2020
Welcome to AmiBrokerAcademy.com. Thanks for visiting the site.
A glance at a chart with Moses. Hold no position and stay free.
Chart At A Glance
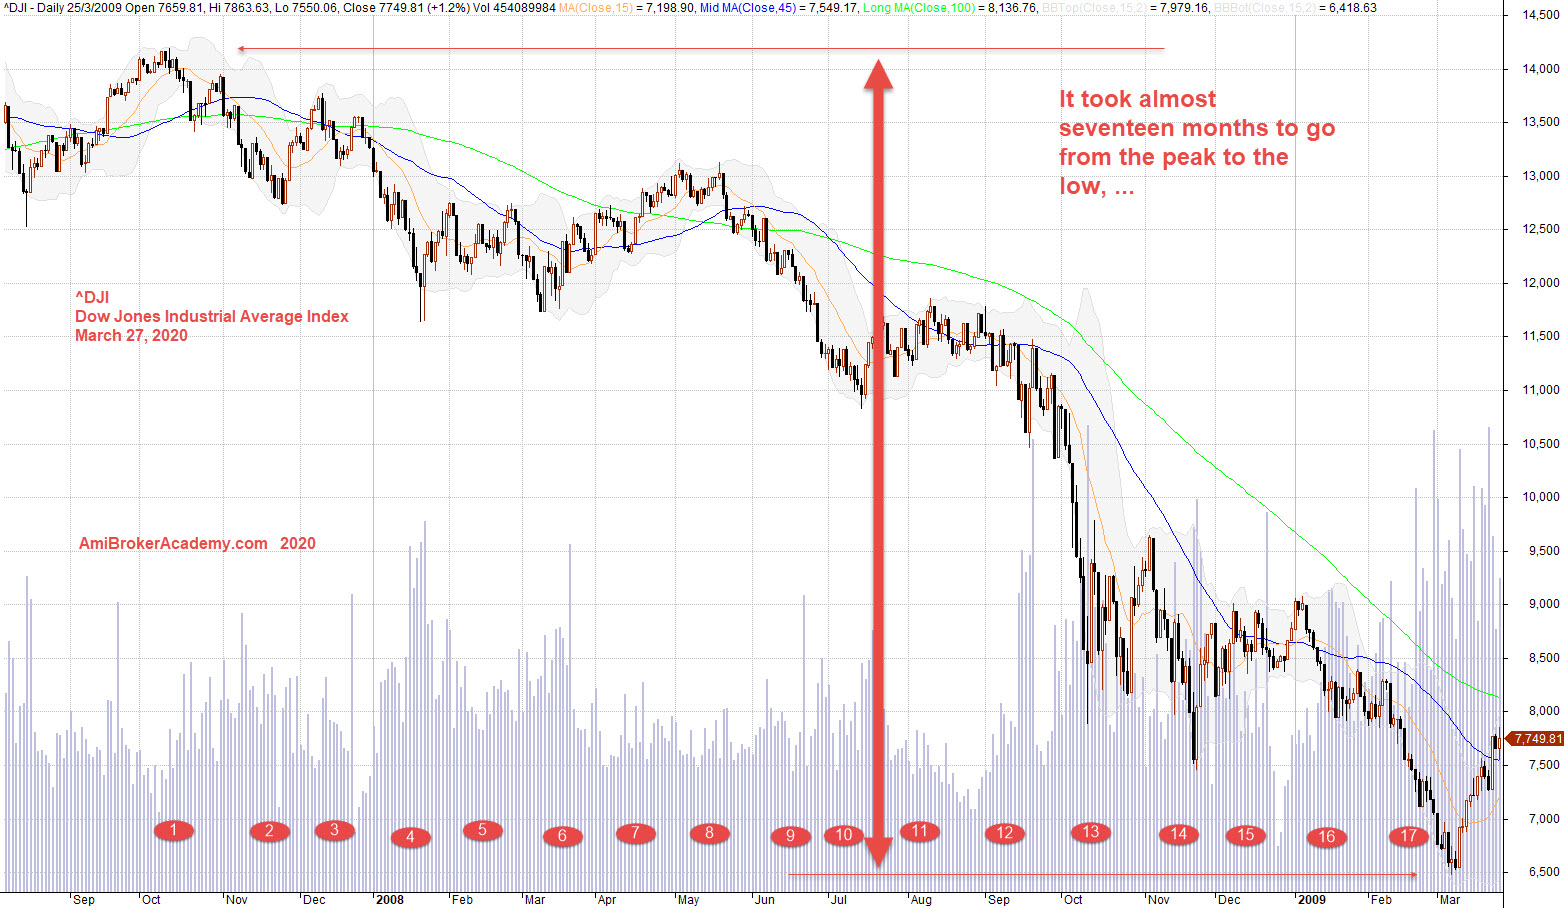
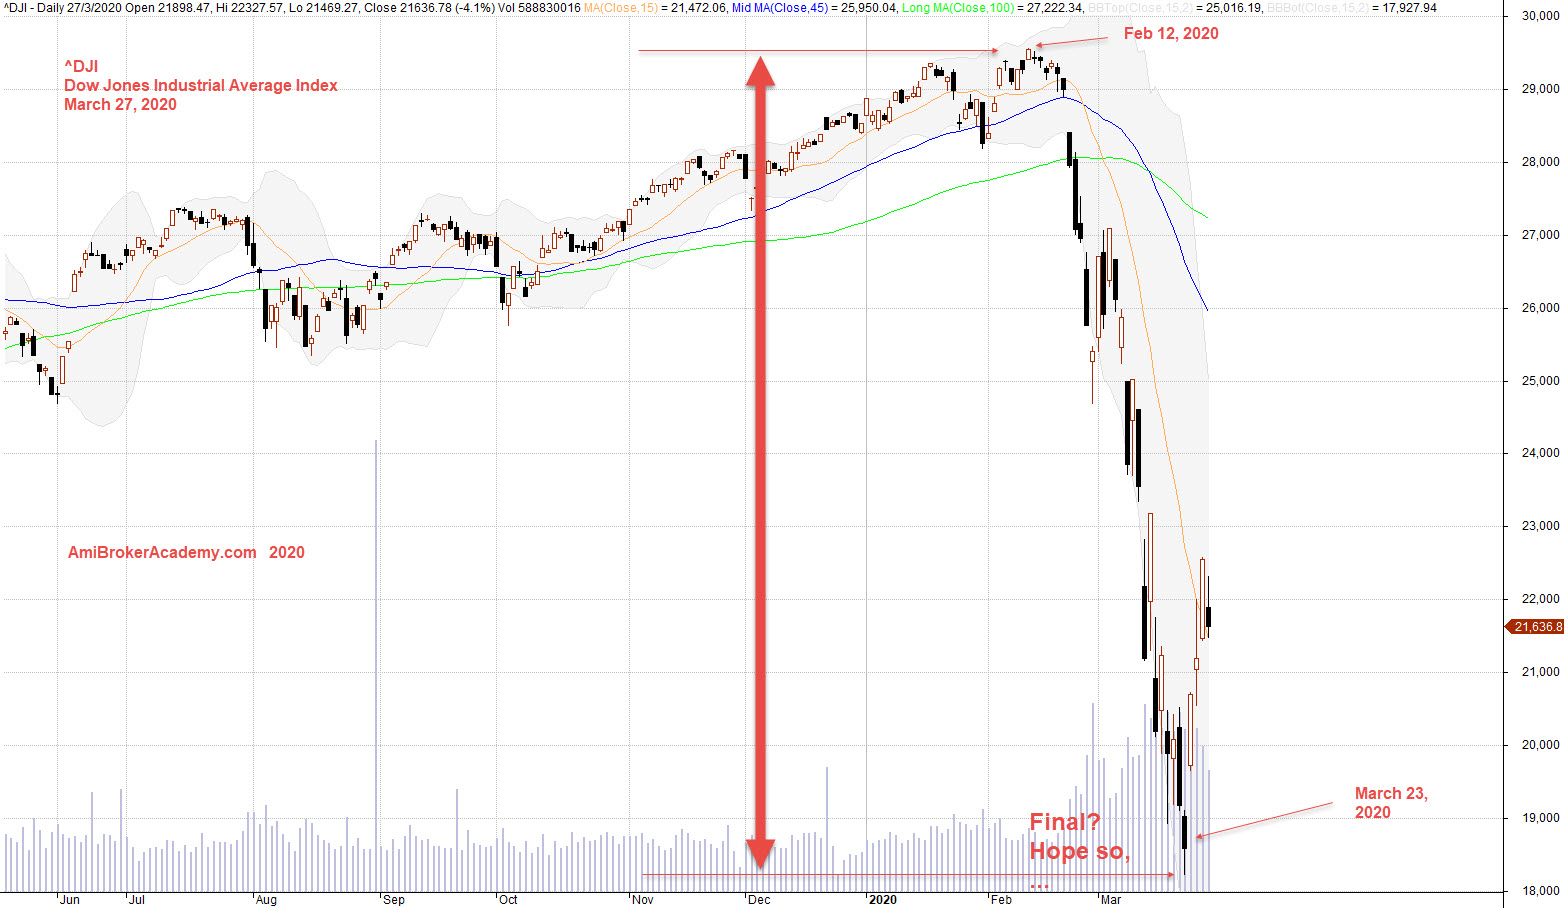
^DJI Dow Jones Industrial Average Index Stock Charting
Study Dow Jones Industrial Average Index stock chart history and price action.
Look left and think right. Manage your expectation.
See chart, picture worth a thousand words.
Study the past to project the future. Trade with what you see and not what you think.
In 2008, price action take almost seventeen months to go from the peak to the bottom.
Think Think Got More Things
Even when the price is up, do you ready to go in? Think, Think got more things.
You might be right! We wish you good luck.
Is this final? We do not know.
Moses Stock Observation
AmiBrokerAcademy.com
Disclaimer
The above result is for illustration purpose. It is not meant to be used for buy or sell decision. We do not recommend any particular stocks. If particular stocks of such are mentioned, they are meant as demonstration of Amibroker as a powerful charting software and MACD. Amibroker can program to scan the stocks for buy and sell signals.
These are script generated signals. Not all scan results are shown here. The MACD signal should use with price action. Users must understand what MACD and price action are all about before using them. If necessary you should attend a course to learn more on Technical Analysis (TA) and Moving Average Convergence Divergence, MACD.
Once again, the website does not guarantee any results or investment return based on the information and instruction you have read here. It should be used as learning aids only and if you decide to trade real money, all trading decision should be your own.