March 9, 2018
US Stock Chart Analysis
BLK BlackRock Inc Charting
See chart, we are looking for the most touch levels, key levels.
Manage your risk!
Powerful Chart Software – AmiBroker
The following chart is produced using AmiBroker charting software. It is a powerful chart software. Anything, finance ticket you could download from Yahoo! Finance you could plot them, those you are interested all in a chart, so you could analyse them. See chart below like the popular Bitcoin.
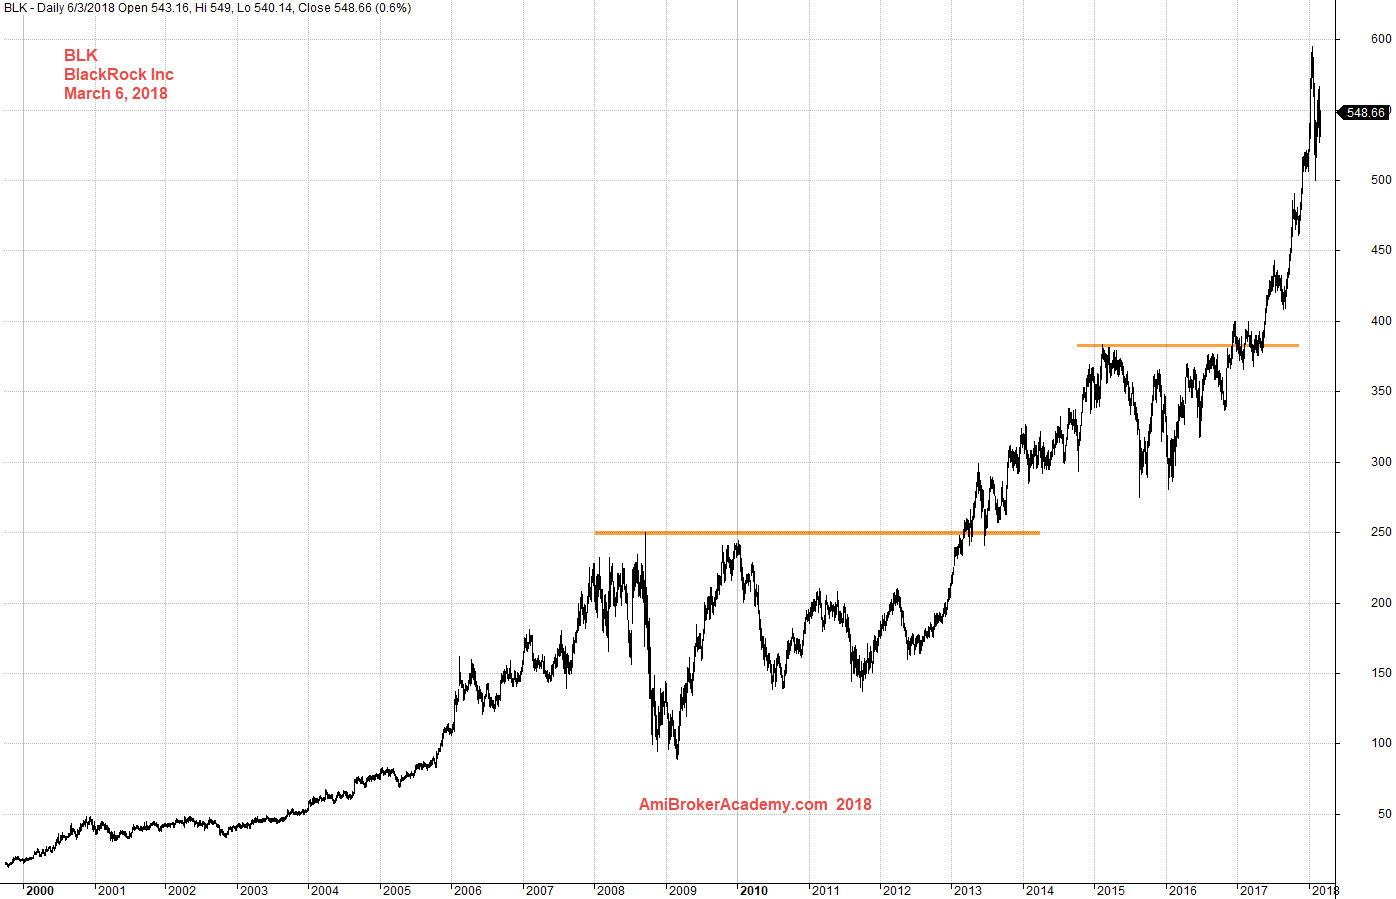
March 6, 2018 BlackRock Inc and Key Levels
BlackRock Inc and Fibo Retracement
Using tool like Fibo retracement to analyse the chart, swing low to high. Price action retrace down to test 61.8% level and punched through the support and rebounce thereafter. The price action stop at 23%.
Manage your risk.
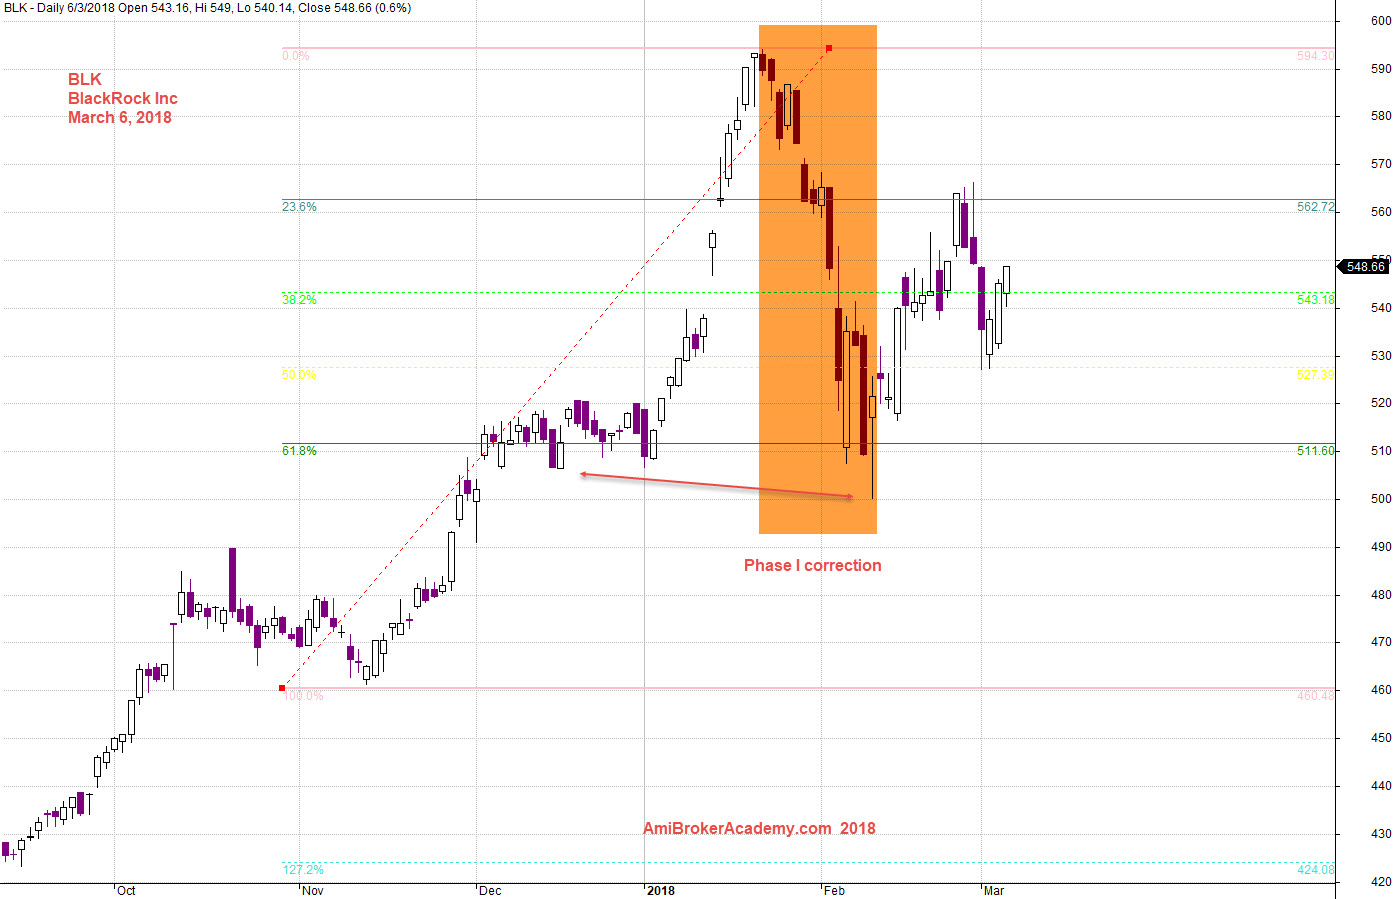
March 6, 2018 BlackRock Inc and Fibo Retracement
Moses US Stock Chart Analysis
AmiBrokerAcademy.com
Disclaimer
The above result is for illustration purpose. It is not meant to be used for buy or sell decision. We do not recommend any particular stocks. If particular stocks of such are mentioned, they are meant as demonstration of Amibroker as a powerful charting software and MACD. Amibroker can program to scan the stocks for buy and sell signals.
These are script generated signals. Not all scan results are shown here. The MACD signal should use with price action. Users must understand what MACD and price action are all about before using them. If necessary you should attend a course to learn more on Technical Analysis (TA) and Moving Average Convergence Divergence, MACD.
Once again, the website does not guarantee any results or investment return based on the information and instruction you have read here. It should be used as learning aids only and if you decide to trade real money, all trading decision should be your own.