9 September, 2018
Bitcoin
Bitcoin, crypto currencies are news from time to time. Let’s study the chart from the data that we can download from Yahoo!.
US Stock Chart Analysis
BTCUSD Bitcoin In US Dollar Charting
Picture worth a thousand words, see chart. The following chart plot for the data we could download from Yahoo!.
We could see for the initial period the price movement was not much. 2013 there were some movement. Only 2017 October to December, the rush and demand of bitcoin were strong. But we could see the price action pullback after the peak when the price reach 20,000 USD a bitcoin.
It will be interest to see using bitcoin to buy someone a beer. The change can be difficult to handle, as my wallet are not big enough to take the change. Have fun!
Trade with eyes open.
Manage your risk!
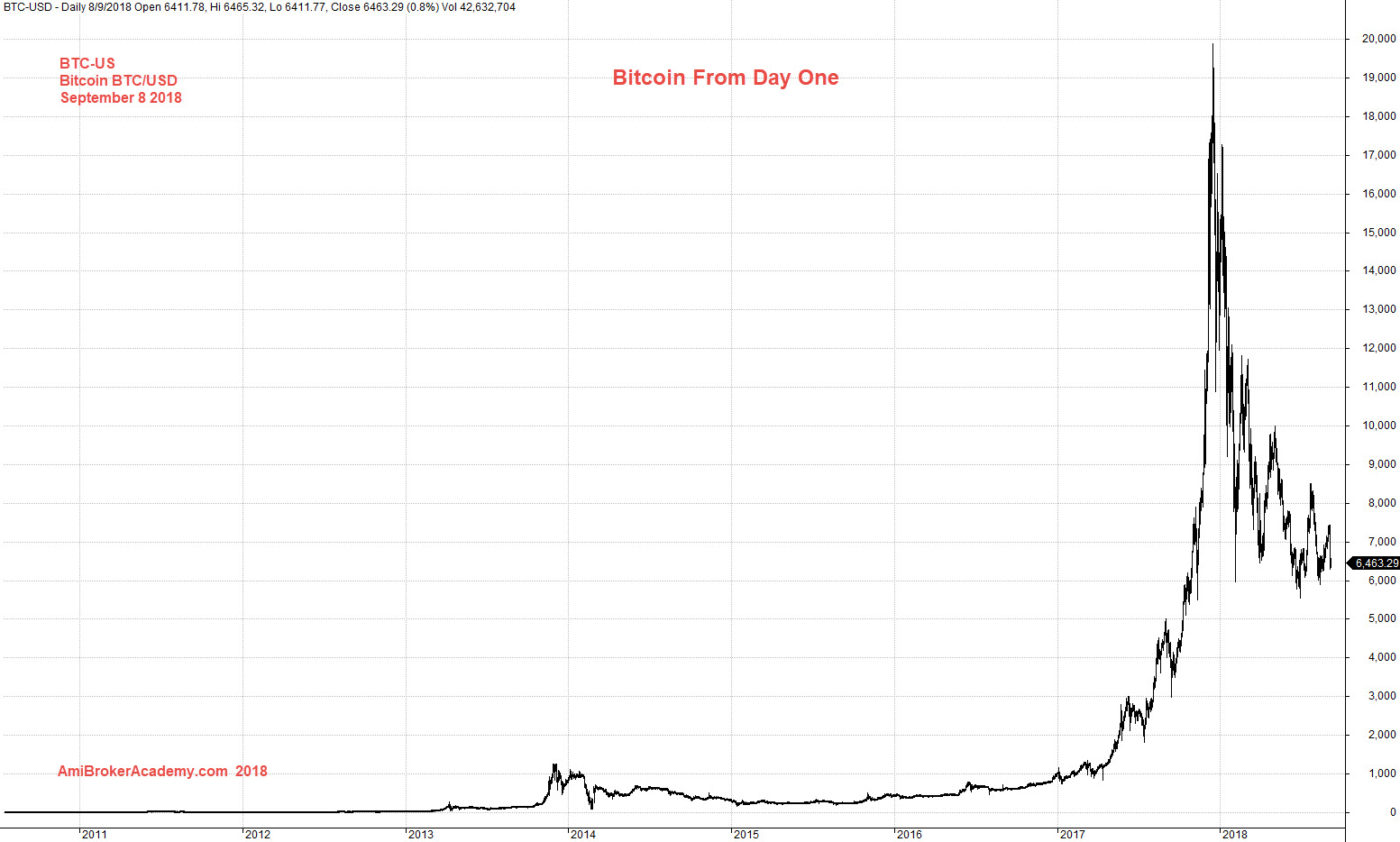
September 8, 2018 Bitcoin in US Dollars from Day One
See chart, picture worth a thousand words. in the initial few years, till 2012 the peak was only slightly above thirty dollars.
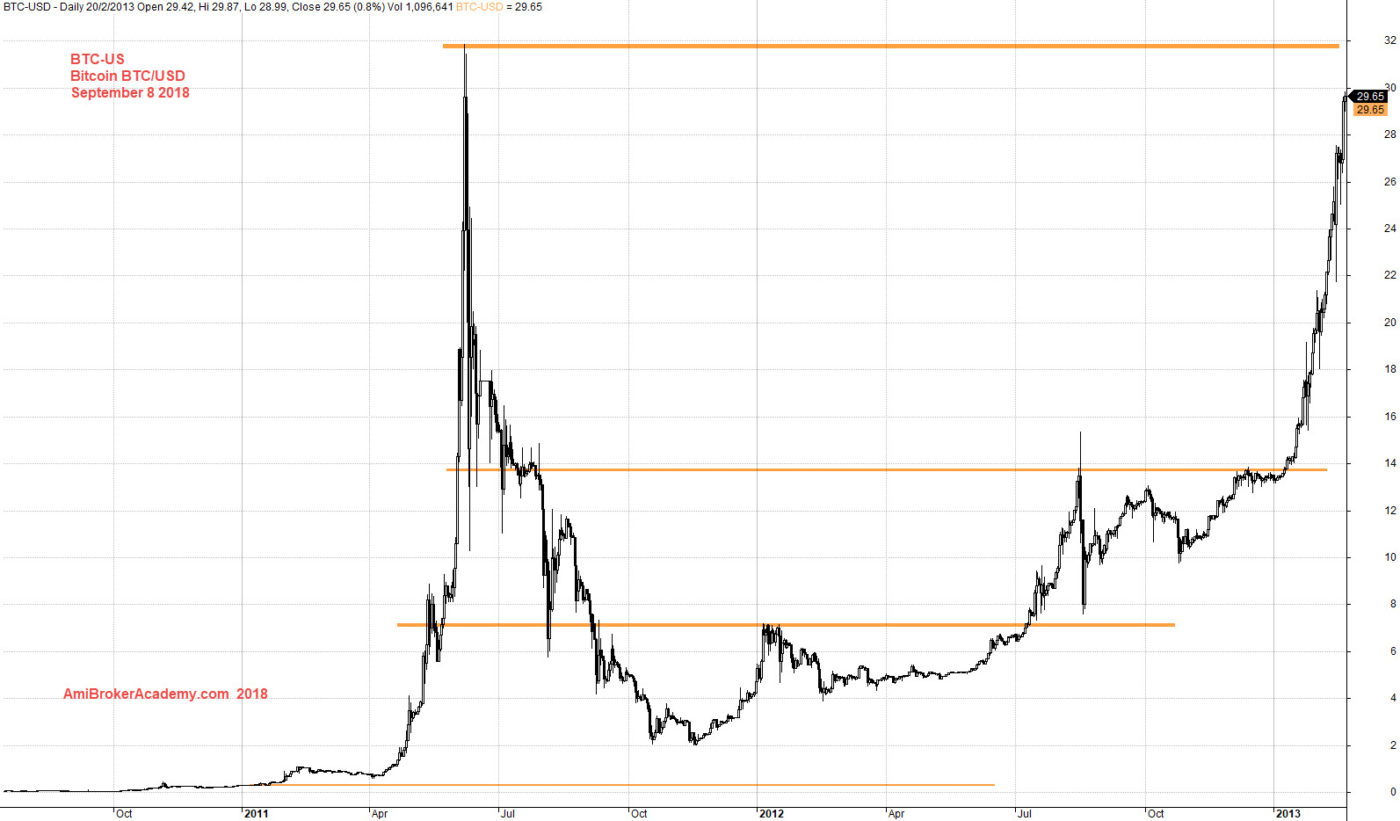
Bitcoin from the start till 2012
From the chart, the price action very quickly pick up and touch 260 dollars. See chart, picture worth a thousand words. Trade with eyes open and manage your risk. There is no different in buy support sell resistance.
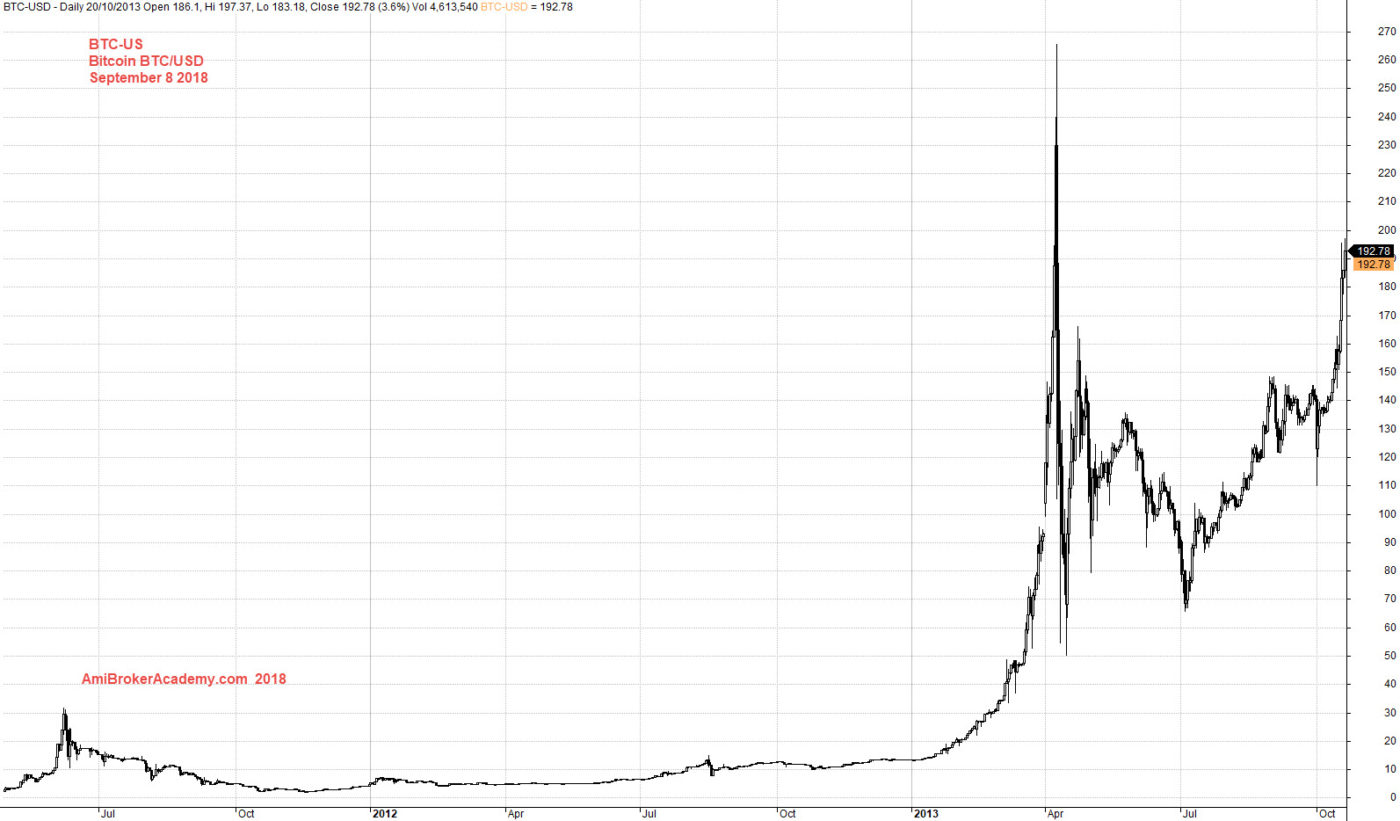
Bitcoin reach 260 in a short time
See chart, in less than ten months the price jump from less than 300 dollars to above one thousand words. Trade with eyes open. Manage your risk.

Bitcoin Less Than Three Months the Price Cross one thousand dollars
Moses US Stock Chart Analysis
AmiBrokerAcademy.com
Disclaimer
The above result is for illustration purpose. It is not meant to be used for buy or sell decision. We do not recommend any particular stocks. If particular stocks of such are mentioned, they are meant as demonstration of Amibroker as a powerful charting software and MACD. Amibroker can program to scan the stocks for buy and sell signals.
These are script generated signals. Not all scan results are shown here. The MACD signal should use with price action. Users must understand what MACD and price action are all about before using them. If necessary you should attend a course to learn more on Technical Analysis (TA) and Moving Average Convergence Divergence, MACD.
Once again, the website does not guarantee any results or investment return based on the information and instruction you have read here. It should be used as learning aids only and if you decide to trade real money, all trading decision should be your own.