March 28, 2018
US Stock Chart Analysis
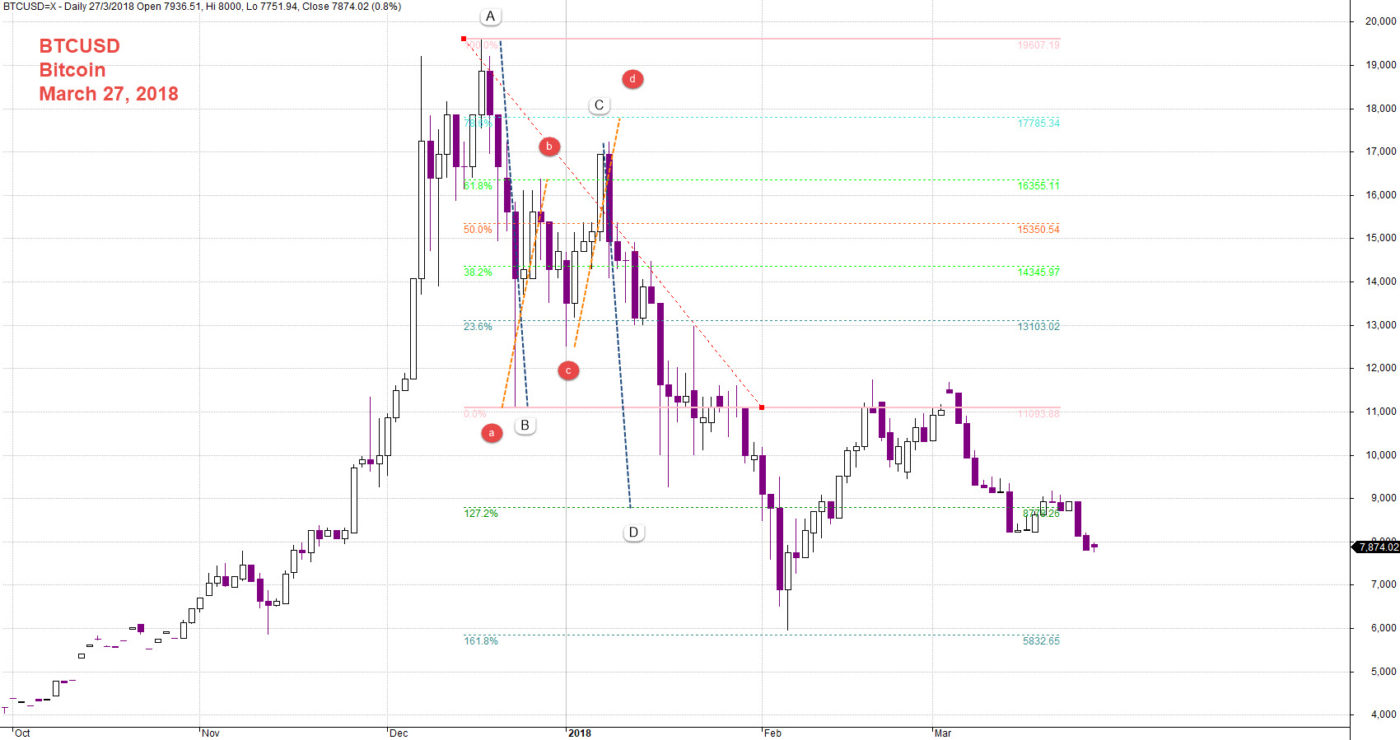
Bitcoin BTCUSD
Study the following chart, the peak is over. Last December is the best for the Bitcoin, nearly tested 20,000 USD a bitcoin. And now below 8,00o USD. Imagine your rush in to try to make money. The true will be the those guys taking profit because of you.
Truly, who will want to own bitcoin instead of real dollar. When the dollar become worthless, you still can use them for wall paper. This was what happen when I was in Shanghai and joking told the boss driver. If you have money buy some gold, real gold, even when the gold price drop and not worth selling. Use them as paper wight. He was so happy to told me few months later. He said I follow your suggest stop focus on stock and bough some gold, real gold now I am very happy, because the gold price has went up and the stock was like yoyo, never go very far. Please understand, this is just a story, a real story. But we do advice your to buy gold. We just feel if your buy something that is not physical when it comes worthless. You can not use them. … Think, think and got more things.
Study the chart, you can see ABCD pattern still apply for bitcoin.
Our Focus – Chart
Emotionally, we may make some remark. Or thinking out loud. But truly, we are very much only like to study chart and try to understand what is the chart try to tell us.
Powerful Chart Software – AmiBroker
The following chart is produced using AmiBroker charting software. It is a powerful chart software. Anything, finance ticket you could download from Yahoo! Finance you could plot them, those you are interested all in a chart, so you could analyse them.
March 27, 2018 Bitcoin Charting BTCUSD
Moses Stock Chart Analysis
AmiBrokerAcademy.com
Disclaimer
The above result is for illustration purpose. It is not meant to be used for buy or sell decision. We do not recommend any particular stocks. If particular stocks of such are mentioned, they are meant as demonstration of Amibroker as a powerful charting software and MACD. Amibroker can program to scan the stocks for buy and sell signals.
These are script generated signals. Not all scan results are shown here. The MACD signal should use with price action. Users must understand what MACD and price action are all about before using them. If necessary you should attend a course to learn more on Technical Analysis (TA) and Moving Average Convergence Divergence, MACD.
Once again, the website does not guarantee any results or investment return based on the information and instruction you have read here. It should be used as learning aids only and if you decide to trade real money, all trading decision should be your own.