January 31, 2019
Welcome to AmiBrokerAcademy.com. We provide US stock analysis for academy learning.
Think!
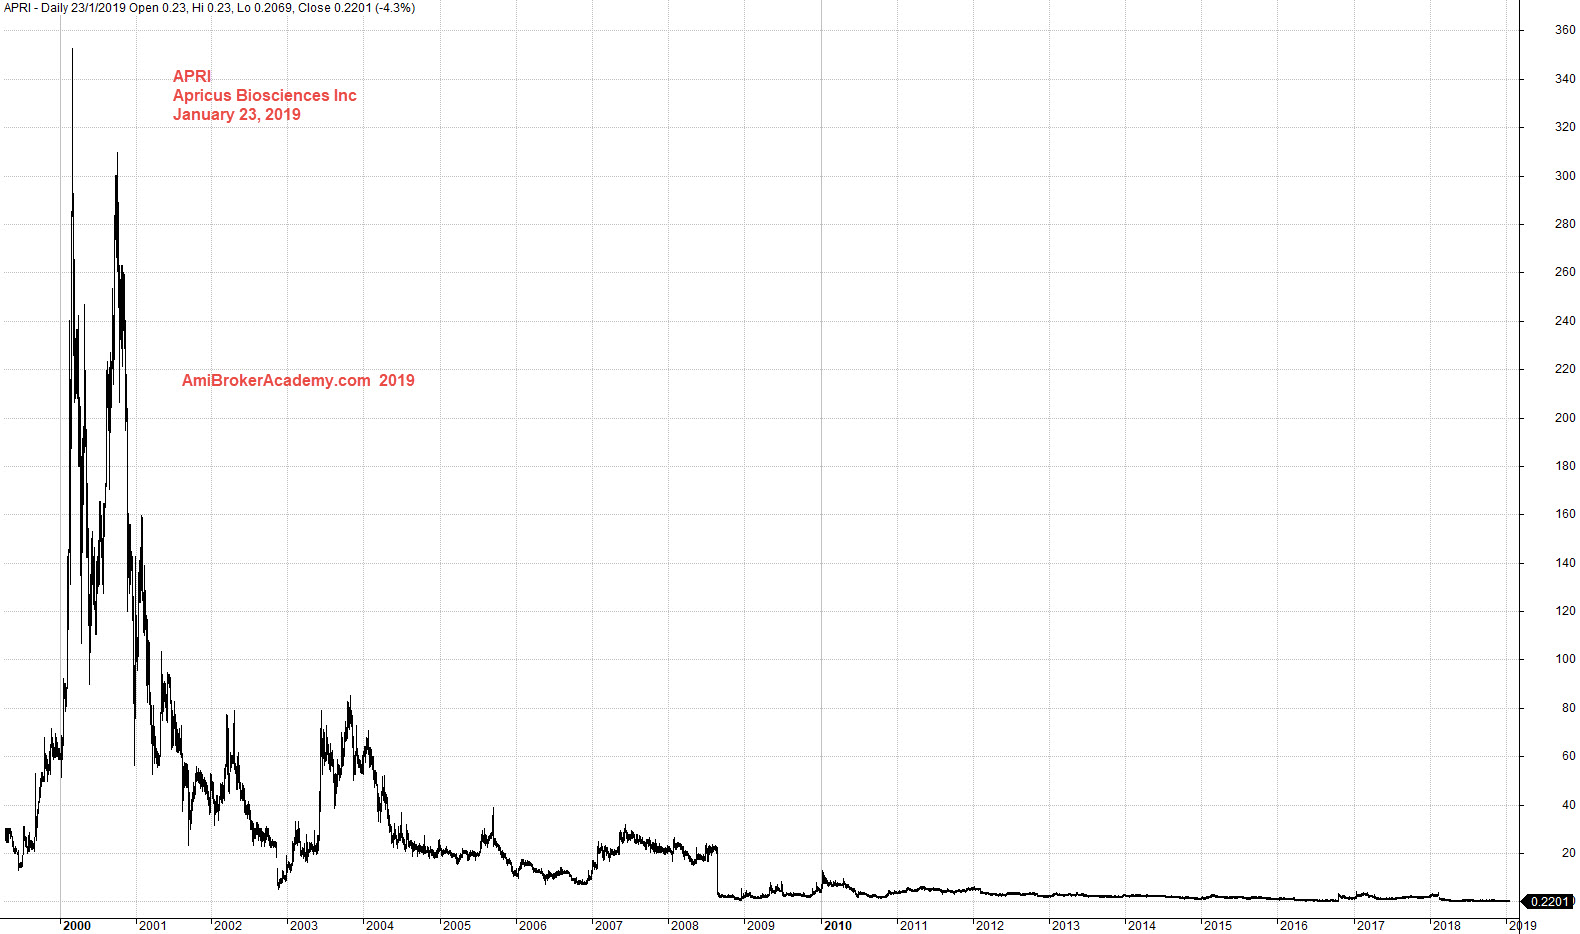
APRI Apricus Biosciences Inc Stock Charting
Study Apricus Biosciences Inc stock chart from day one.
Picture worth a thousand words, see chart. Is it the reflection of its industry? Will I don’t know. But, the chart just shows the market seems to lost interest of the stock over the last eighteen years.
Show, fundamental sometimes could be difficult to understand. Some judge from the products, some thinking of its future. But, one thing for sure is it is a heavy investment in R&D and equipment.
You probably can see those that just sell sell and sell make more money. As they are just add on the cost of them and make more money. Think. Do your own research and don’t take all words here.
Trade with eyes open.
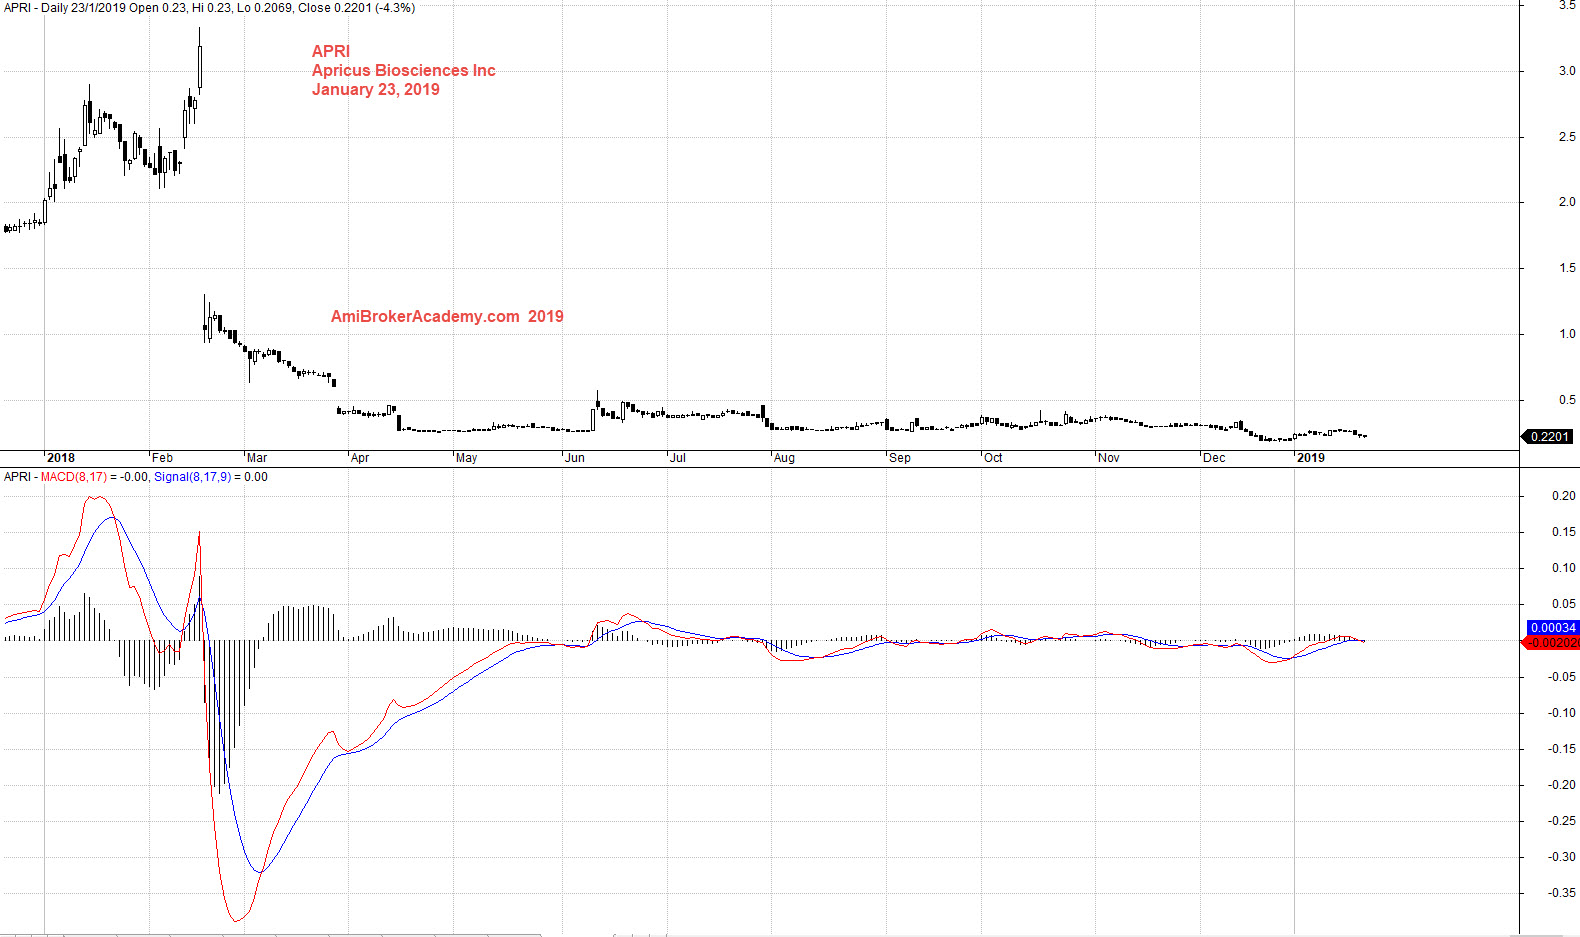
Study chart with MACD, you probably see the MACD in the following chart is near zeroline.
Moses Stock Analysis
AmiBrokerAcademy.com
Disclaimer
The above result is for illustration purpose. It is not meant to be used for buy or sell decision. We do not recommend any particular stocks. If particular stocks of such are mentioned, they are meant as demonstration of Amibroker as a powerful charting software and MACD. Amibroker can program to scan the stocks for buy and sell signals.
These are script generated signals. Not all scan results are shown here. The MACD signal should use with price action. Users must understand what MACD and price action are all about before using them. If necessary you should attend a course to learn more on Technical Analysis (TA) and Moving Average Convergence Divergence, MACD.
Once again, the website does not guarantee any results or investment return based on the information and instruction you have read here. It should be used as learning aids only and if you decide to trade real money, all trading decision should be your own.