May 28, 2019
Welcome!
Welcome to AmiBrokerAcademy.com. Thanks for visiting the site.
Have fun!
BTC-USD Bitcoin Charting
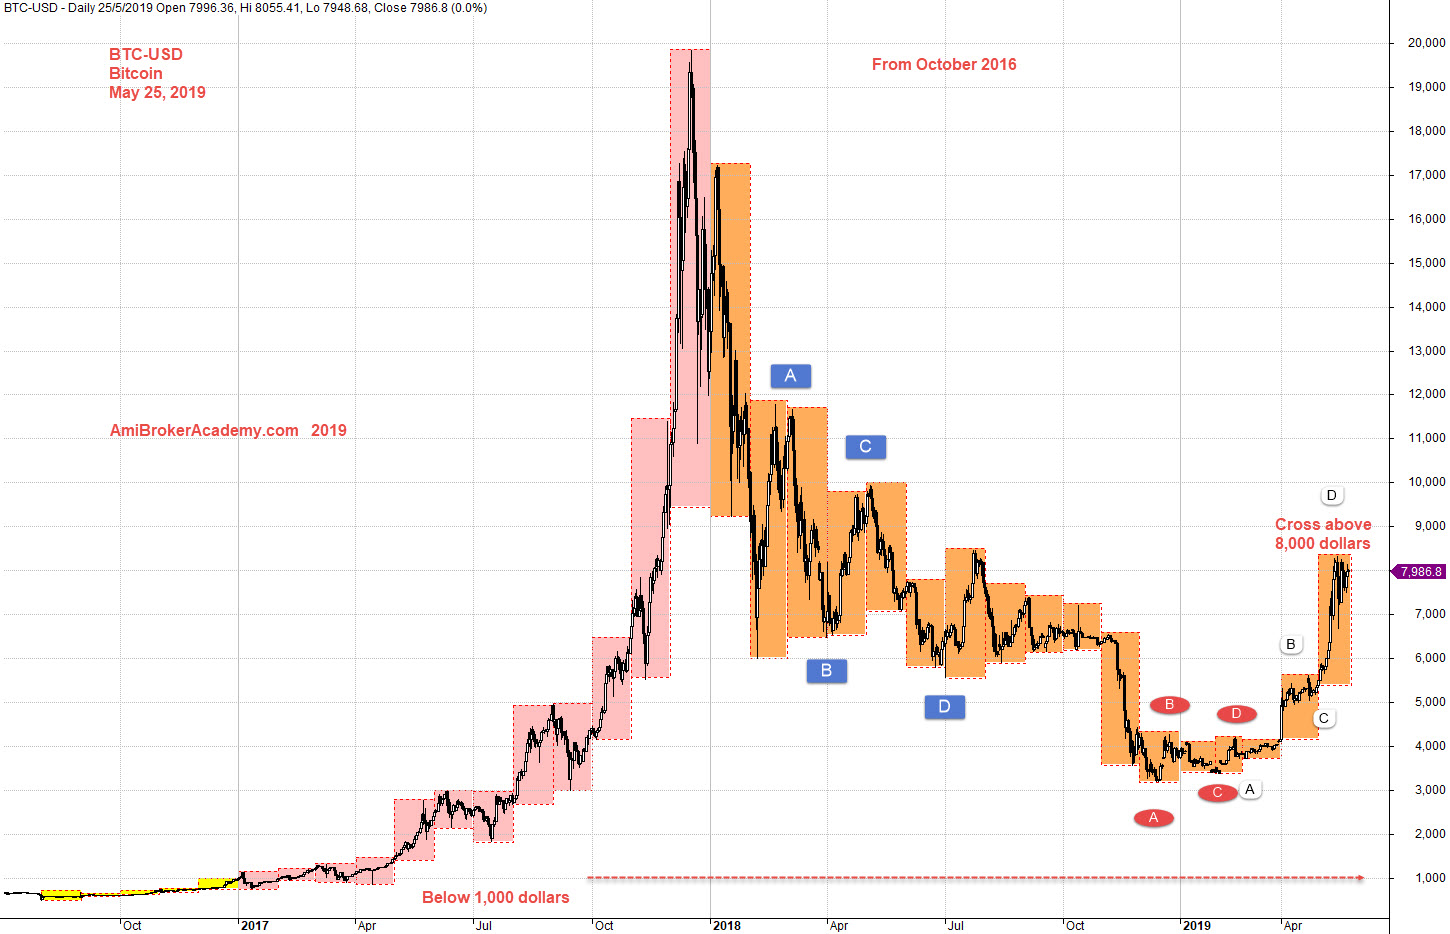
Study Bitcoin chart and month high low.
See chart, picture worth a thousand words.
Those whom started bitcoin in the early day was happy when the price went rock high to near 20,000 dollars. Many was rush in to catch the wave.
Those who came in near 20,000 dollars were trapped. Many may have exited when the price action has a great deep.
Manage your risk and trade with your eyes open.
Always remember to trade – buy low and sell high and not buy high sell higher.
Now you understand why we have been using MACD indicator to scan, to do charting. As MACD is a leading indicator for reversal strategy.
Reversal strategy helps us to understand the timing on buying low and selling high.
Moses Stock Observation
AmiBrokerAcademy.com
Disclaimer
The above result is for illustration purpose. It is not meant to be used for buy or sell decision. We do not recommend any particular stocks. If particular stocks of such are mentioned, they are meant as demonstration of Amibroker as a powerful charting software and MACD. Amibroker can program to scan the stocks for buy and sell signals.
These are script generated signals. Not all scan results are shown here. The MACD signal should use with price action. Users must understand what MACD and price action are all about before using them. If necessary you should attend a course to learn more on Technical Analysis (TA) and Moving Average Convergence Divergence, MACD.
Once again, the website does not guarantee any results or investment return based on the information and instruction you have read here. It should be used as learning aids only and if you decide to trade real money, all trading decision should be your own.