29 April, 2018
Singapore Stock Analysis
BHQ Sunningdale Tech and Fibonacci Retracement Low to High
Study Sunningdale Tech stock price using Fibonacci Retracemnet, swing low to high. Manage your risk. The stock price after 2.4, begin to move lower. The price action just can not hold at 50% level. The stock price breakout below 1.70 and just enjoy the “free fall”, breakout lower than 61%, and even 78%. Now the stock price is below 78%. Is the stock similar to ZTE and affected by the US new trade policy? Or the company is affected by the major client performance? Will, may have to check the fundamental factor? Watch your trade.
Manage your risk.
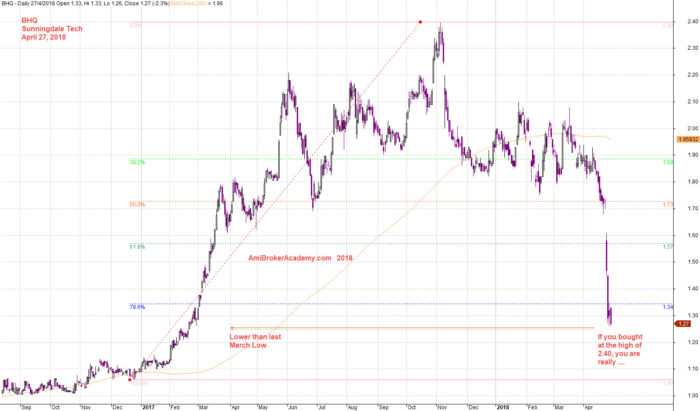
April 27, 2018 Sunningdale Tech and Fibo Retracement Low to High
In One Week BHQ Sunningdale Tech Stock Price Fall 26%
See chart, on MACD indicator.
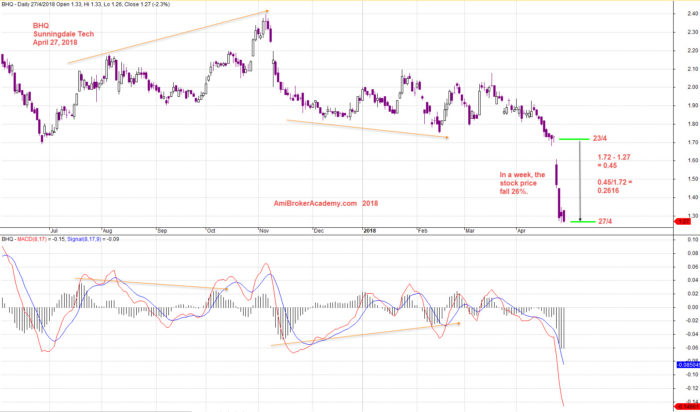
April 27, 2018 Sunningdale Tech and MACD
Moses Singapore Stock Analysis
AmiBrokerAcademy.com
Disclaimer
The above result is for illustration purpose. It is not meant to be used for buy or sell decision. We do not recommend any particular stocks. If particular stocks of such are mentioned, they are meant as demonstration of Amibroker as a powerful charting software and MACD. Amibroker can program to scan the stocks for buy and sell signals.
These are script generated signals. Not all scan results are shown here. The MACD signal should use with price action. Users must understand what MACD and price action are all about before using them. If necessary you should attend a course to learn more on Technical Analysis (TA) and Moving Average Convergence Divergence, MACD.
Once again, the website does not guarantee any results or investment return based on the information and instruction you have read here. It should be used as learning aids only and if you decide to trade real money, all trading decision should be your own.