15 August 2021
Welcome!
Welcome to AmiBroker Academy dot com, amibrokeracademy.com.
How to use simple chart to trade well. GO BEYOND!
- Trade what you see. 2. Manage your risk.
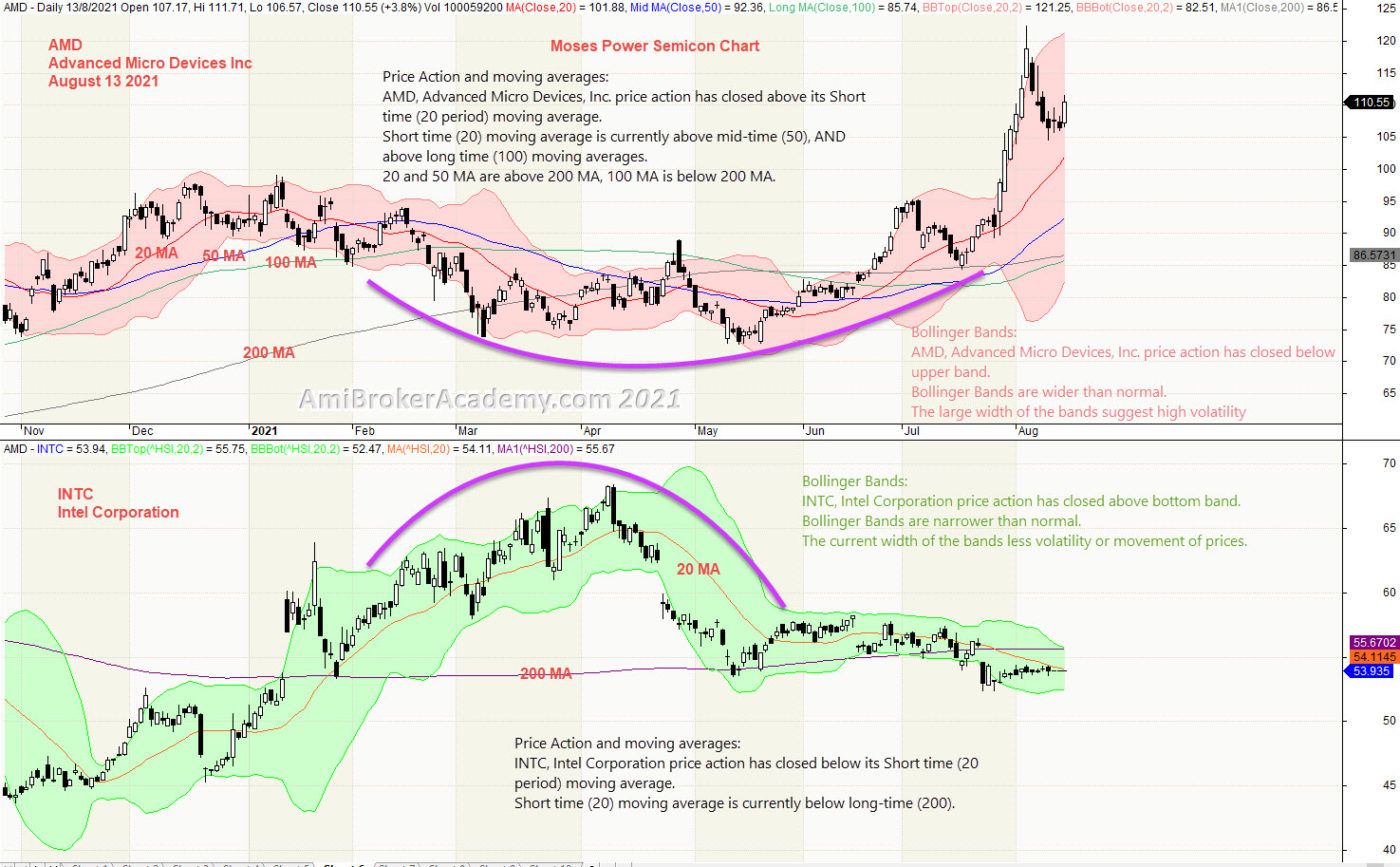
1) Advanced Micro Device Inc and Intel Corporation Correlation and Bollinger Bands Gro Corporation
Semiconductor Sector is a volatile market. Many of the automation and automobile are depending on them.
Study two key corporations, AMD and Intel stock price to understand what the market emotions.
AmiBroker charting software is a great charting software that you can easily benchmark two or more stock price.
See chart, picture worth a thousand words.
Manage your risk.
Moses Power Charting
Official AmiBrokerAcademy.com Charting
Disclaimer
The above result is for illustration purpose. It is not meant to be used for buy or sell decision. We do not recommend any particular stocks. If particular stocks of such are mentioned, they are meant as demonstration of Amibroker as a powerful charting software and MACD. Amibroker can program to scan the stocks for buy and sell signals.
These are script generated signals. Not all scan results are shown here. The MACD signal should use with price action. Users must understand what MACD and price action are all about before using them. If necessary you should attend a course to learn more on Technical Analysis (TA) and Moving Average Convergence Divergence, MACD.
Once again, the website does not guarantee any results or investment return based on the information and instruction you have read here. It should be used as learning aids only and if you decide to trade real money, all trading decision should be your own.
We learn from many past and present great traders. Kudo to these master.