June 26, 2018
Thanks for visiting the site.
上海证券交易所综合股价指数 SSE Composite IndexCharting
For the same chart, every trader will read the chart differently. You could see our early analysis on the same chart.
China 上海证券交易所综合股价指数 SSE Composite Index has down for more than 20% in 2018. Is the market crashing (as we do not know the current low is the final)? See chart, 上海证券交易所综合股价指数 SSE Composite Index overall bearish in 2018. Manage your risk.
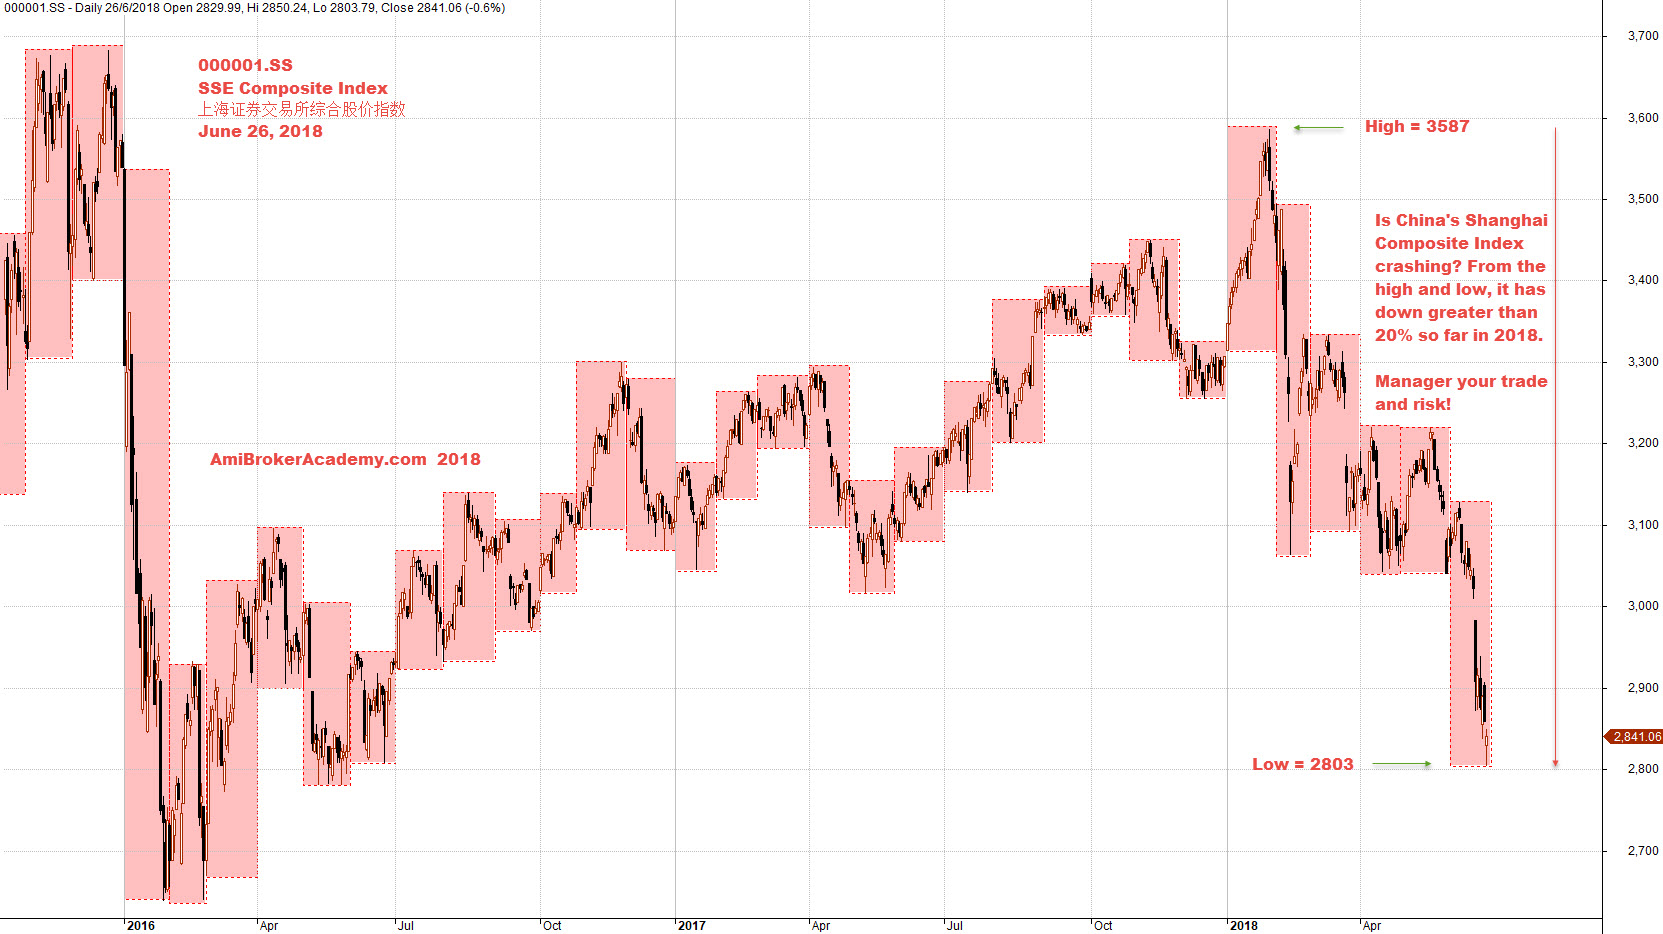
June 26, 2018 上海证券交易所综合股价指数 SSE Composite Index Charting
Moses
AmiBrokerAcademy.com
Disclaimer
The above result is for illustration purpose. It is not meant to be used for buy or sell decision. We do not recommend any particular stocks. If particular stocks of such are mentioned, they are meant as demonstration of Amibroker as a powerful charting software and MACD. Amibroker can program to scan the stocks for buy and sell signals.
These are script generated signals. Not all scan results are shown here. The MACD signal should use with price action. Users must understand what MACD and price action are all about before using them. If necessary you should attend a course to learn more on Technical Analysis (TA) and Moving Average Convergence Divergence, MACD.
Once again, the website does not guarantee any results or investment return based on the information and instruction you have read here. It should be used as learning aids only and if you decide to trade real money, all trading decision should be your own.