11 September, 2018
Thanks for visiting the site.
TWTR Twitter Inc Charting
Buy Support Sell Resistance or Buy Low Sell High
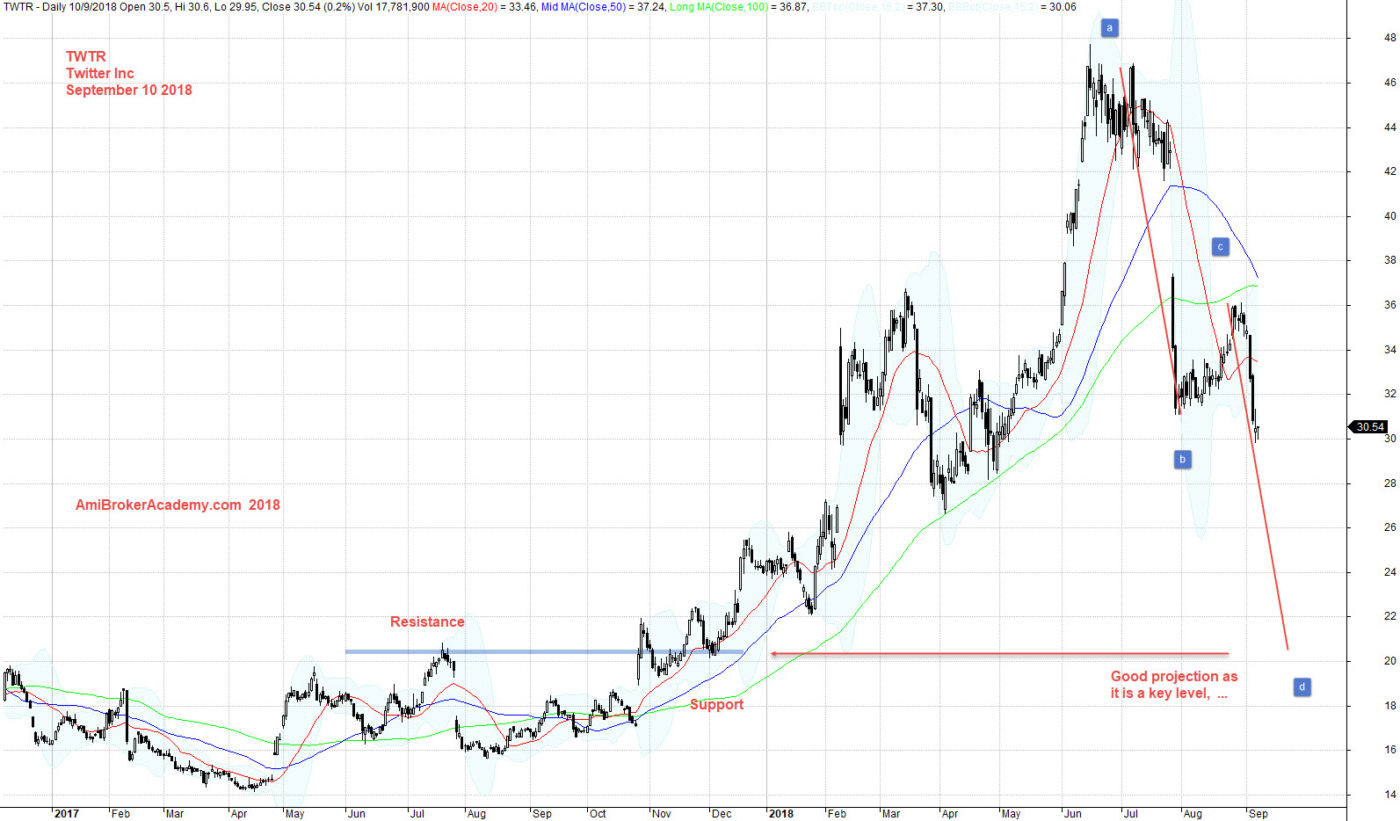
Study chart of Twitter Inc stock price. Apply buy support and sell resistance strategy, see chart picture worth a thousand words, where is the support, where is the resistance.
Stock price tested 48 dollars level and fail. Worst, after try to sustain for sometime gap down, why? It does not matter the reason, but the fact you can easily spot a bearish ABCD pattern. 20 dollars is a good level for the price action to get supported. Trade with eyes open.
Remind you again, buy support and sell resistance.
Manage your risk.
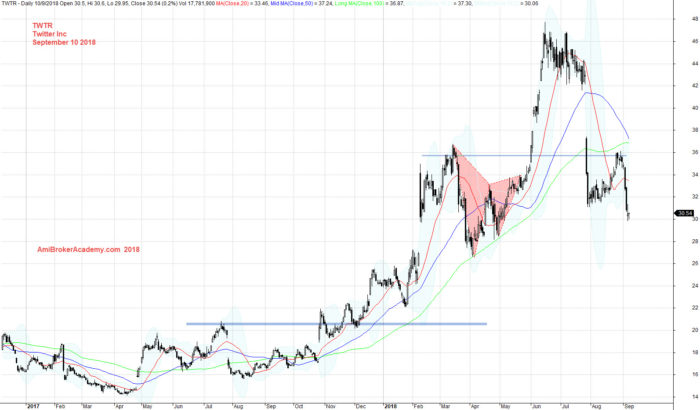
September 10, 2018 Twitter Inc Projection
See chart, price action tested 36 dollars, and forms a butterfly pullback lower to go below 28 dollars. The price action breakout of the last resistance, 36 and goes higher. Now the price action retest the 36 dollars and fail. Be ready the the price action to touch 20. Trade with eyes open.
September 10, 2018 Twitter Inc and Pattern
As we believe, it is always great to have more data, see chart below. The price action stop and support at each of the key levels. See chart from IPO day.
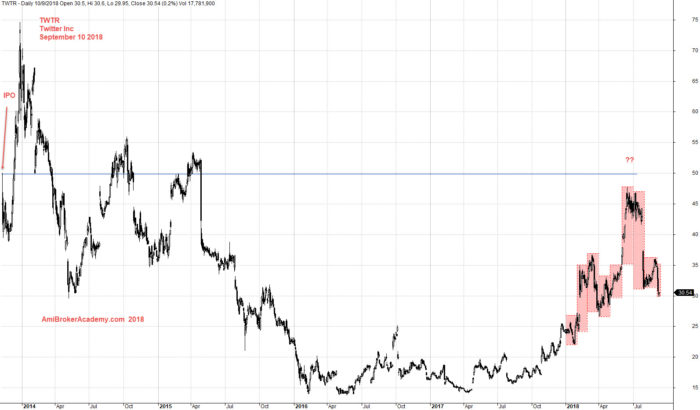
September 10, 2018 Twitter Inc From IPO
Moses US Stock Chart Analysis
AmiBrokerAcademy.com
Disclaimer
The above result is for illustration purpose. It is not meant to be used for buy or sell decision. We do not recommend any particular stocks. If particular stocks of such are mentioned, they are meant as demonstration of Amibroker as a powerful charting software and MACD. Amibroker can program to scan the stocks for buy and sell signals.
These are script generated signals. Not all scan results are shown here. The MACD signal should use with price action. Users must understand what MACD and price action are all about before using them. If necessary you should attend a course to learn more on Technical Analysis (TA) and Moving Average Convergence Divergence, MACD.
Once again, the website does not guarantee any results or investment return based on the information and instruction you have read here. It should be used as learning aids only and if you decide to trade real money, all trading decision should be your own.