25 August, 2019
Welcome to AmiBrokerAcademy.com. Thanks for visiting the site.
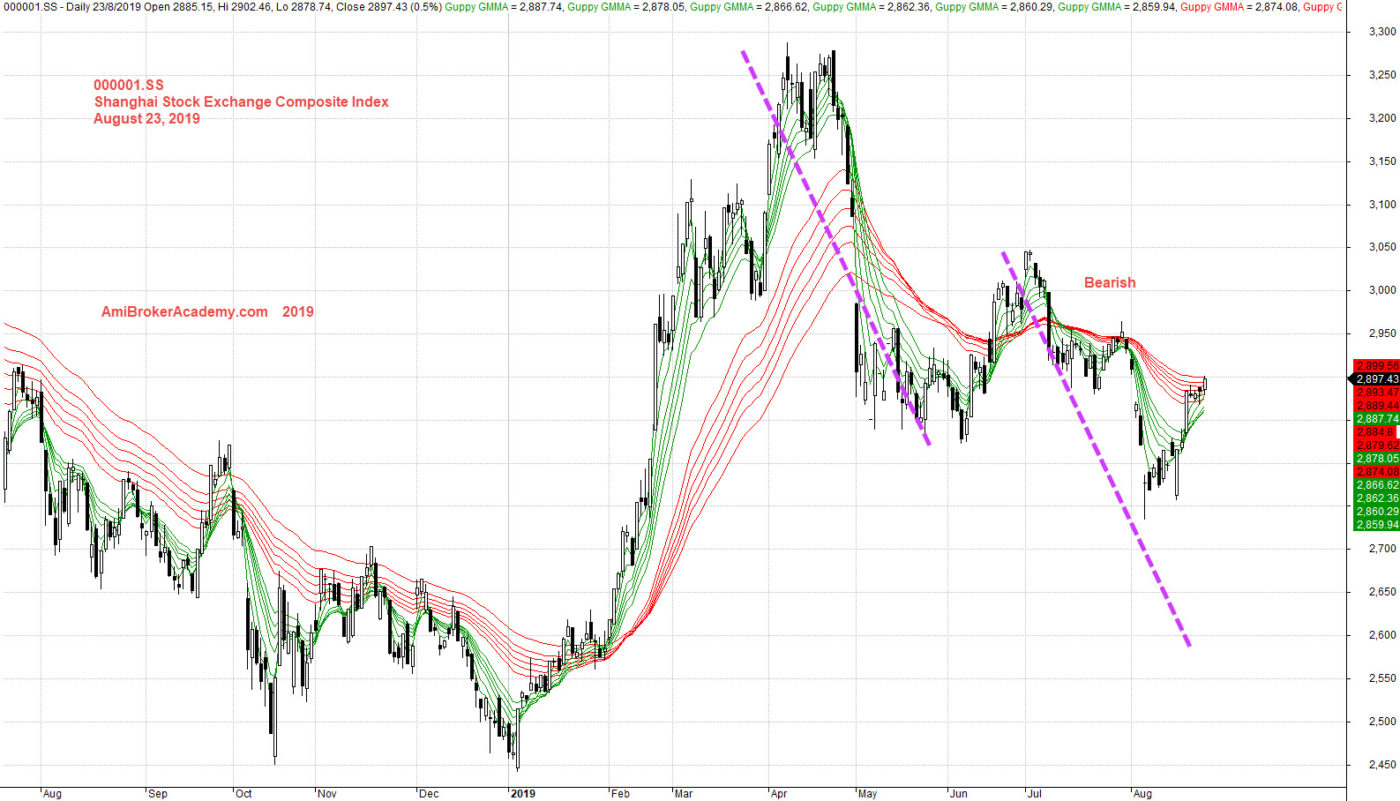
000001.SS Shanghai Stock Exchange Composite index 上海证交所指数 Stock Charting
Study Shanghai Stock Exchange Composite index 上海证交所指数 Stock chart and GMMA.
See chart, picture worth a thousand words.
GMMA uses two sets of MA. See chart, Slow MA slopping down, and Fast MA stay below; bear trend.
After retest the low, price action reverse. Price Action retrace up. If you are H M Gartley fan, see the AB = CD pattern. The price action is now in the CD leg.
Trade with your eyes open.
Moses Stock Observation
AmiBrokerAcademy.com
Disclaimer
The above result is for illustration purpose. It is not meant to be used for buy or sell decision. We do not recommend any particular stocks. If particular stocks of such are mentioned, they are meant as demonstration of Amibroker as a powerful charting software and MACD. Amibroker can program to scan the stocks for buy and sell signals.
These are script generated signals. Not all scan results are shown here. The MACD signal should use with price action. Users must understand what MACD and price action are all about before using them. If necessary you should attend a course to learn more on Technical Analysis (TA) and Moving Average Convergence Divergence, MACD.
Once again, the website does not guarantee any results or investment return based on the information and instruction you have read here. It should be used as learning aids only and if you decide to trade real money, all trading decision should be your own.