September 16, 2017
If you have read our last posting on Amazon.com chart analysis lesson learnt, we suggest trader to consider trading retracement, so can obtain buy low and sell high and not buy high and wait to sell higher.
The following analysis, we will illustrate the wait to decide to get out first before join the trade again. Taking out profit before the profit get eroded. Have fun reading.
Amazon.com Chart Analysis
How You Think When You Read a Chart?
Picture worth a thousand words, see the analysis on the chart.
We use the similar style in analyse GOOG stock in the recent posting, Check them out. Have fun!
Note: You could find the similar analysis on our recent GOOG chart analysis too. Check it out.
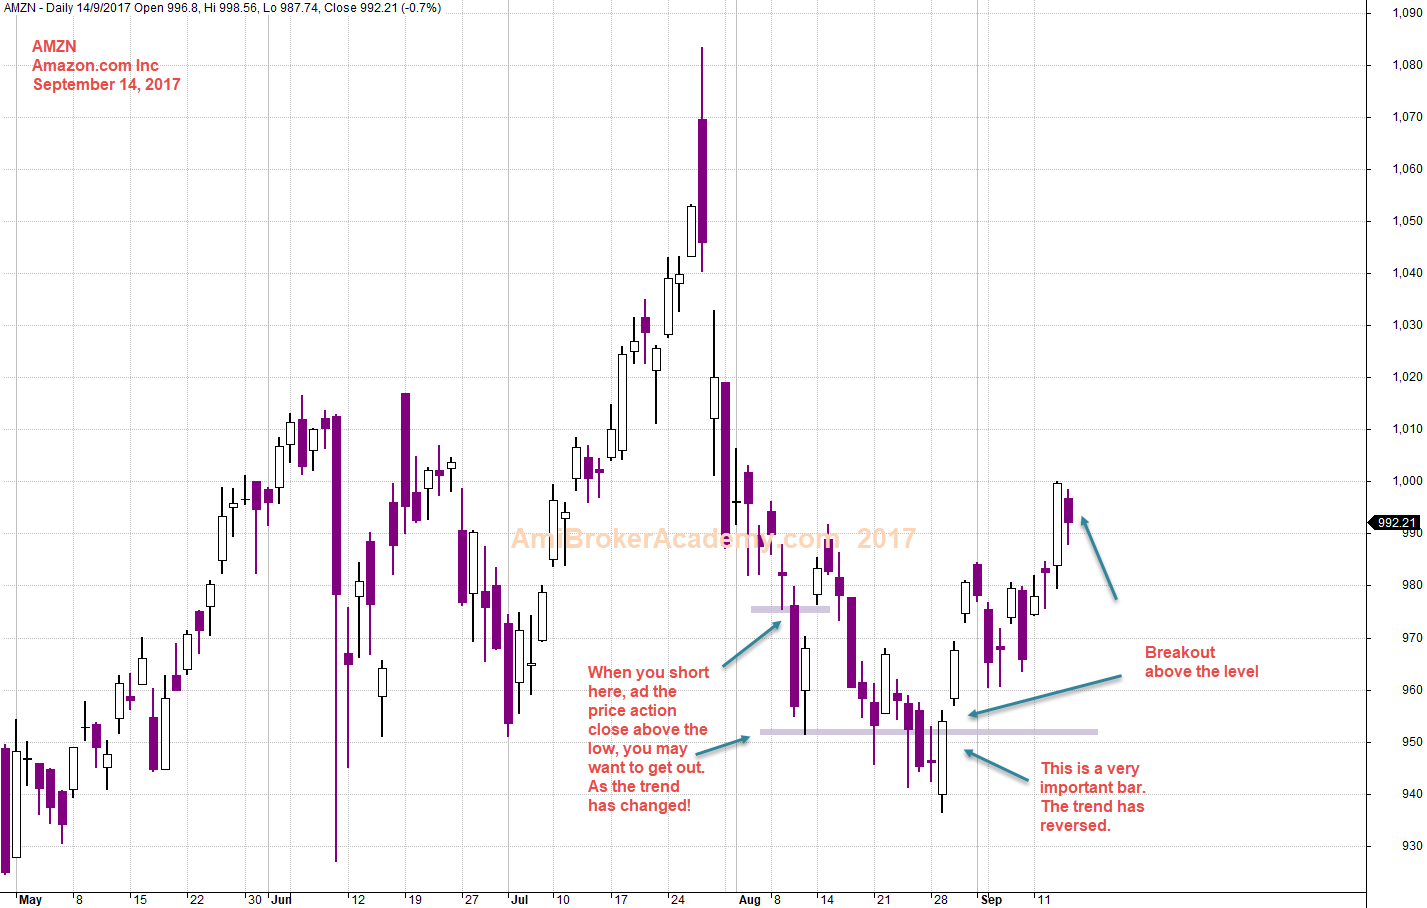
September 14, 2017 Amazon.com and Reading Bar by Bar
Thanks for visit the site here. You could also find free MACD scan here in this site too.
Moses
AmiBrokerAcademy.com
Disclaimer
The above result is for illustration purpose. It is not meant to be used for buy or sell decision. We do not recommend any particular stocks. If particular stocks of such are mentioned, they are meant as demonstration of Amibroker as a powerful charting software and MACD. Amibroker can program to scan the stocks for buy and sell signals.
These are script generated signals. Not all scan results are shown here. The MACD signal should use with price action. Users must understand what MACD and price action are all about before using them. If necessary you should attend a course to learn more on Technical Analysis (TA) and Moving Average Convergence Divergence, MACD.
Once again, the website does not guarantee any results or investment return based on the information and instruction you have read here. It should be used as learning aids only and if you decide to trade real money, all trading decision should be your own.