November 10, 2018
Thanks for visiting the site.
There is a reason for everything. Perhaps at the moment you can not see it, but it does not mean it is not present. Be aware.
Moses Stock Analysis
Banks Stock Charting – UOB and DBS Stock Chart
Buy low sell high, buy support sell resistance.
See chart, the price action of botch UOB and DBS stock chart.
Apply buy low sell high and buy hold strategy. Imagine you compare the two stock charts both stock chart looks quite the same. See charts, picture worth a thousand words. But if you use H M Gartley 222, you can spot some different.
Trade with eyes open, manage your risk.
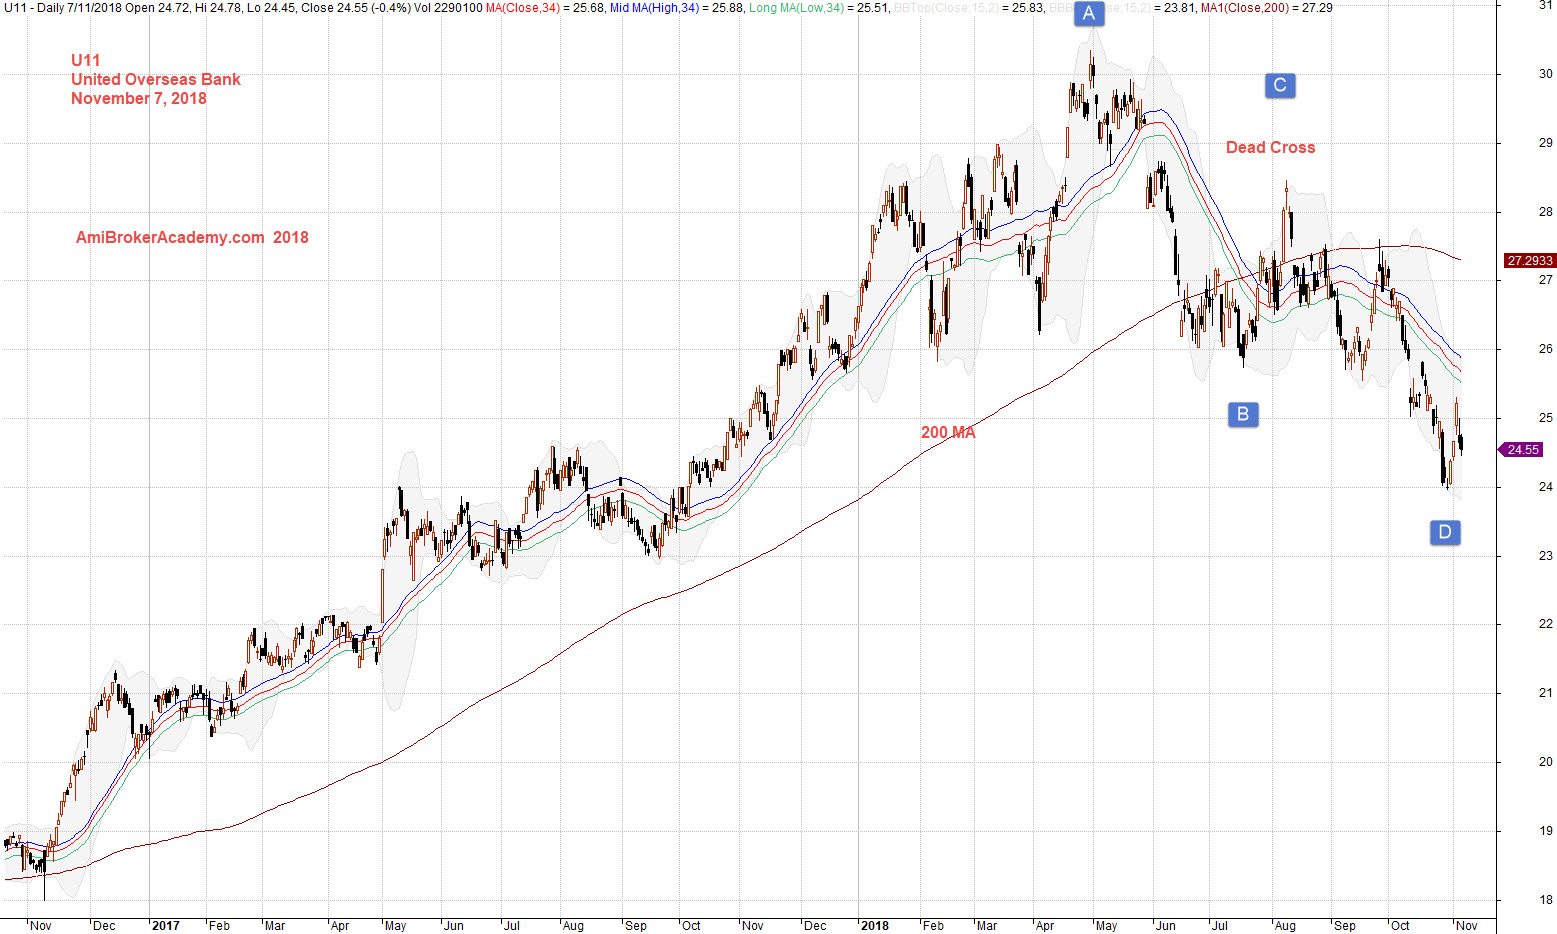
November 7, 2018 United Overseas Bank and River
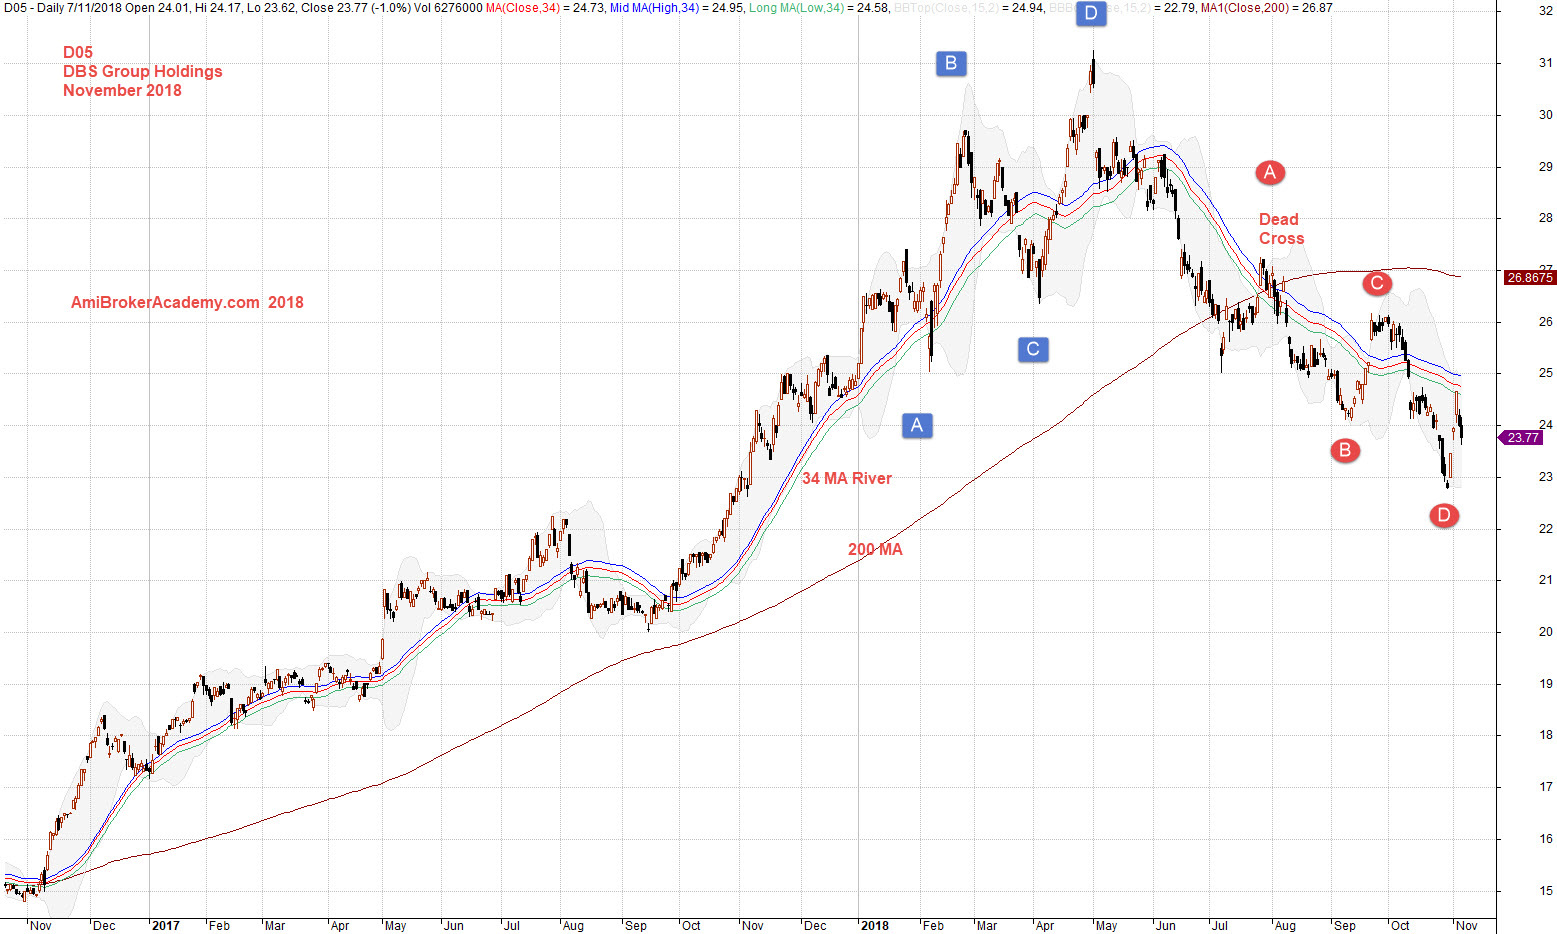
November 7, 2018 DBS Group Holdings and River
Moses
AmiBrokerAcademy.com
Disclaimer
The above result is for illustration purpose. It is not meant to be used for buy or sell decision. We do not recommend any particular stocks. If particular stocks of such are mentioned, they are meant as demonstration of Amibroker as a powerful charting software and MACD. Amibroker can program to scan the stocks for buy and sell signals.
These are script generated signals. Not all scan results are shown here. The MACD signal should use with price action. Users must understand what MACD and price action are all about before using them. If necessary you should attend a course to learn more on Technical Analysis (TA) and Moving Average Convergence Divergence, MACD.
Once again, the website does not guarantee any results or investment return based on the information and instruction you have read here. It should be used as learning aids only and if you decide to trade real money, all trading decision should be your own.