January 24, 2018
US Stock Analysis
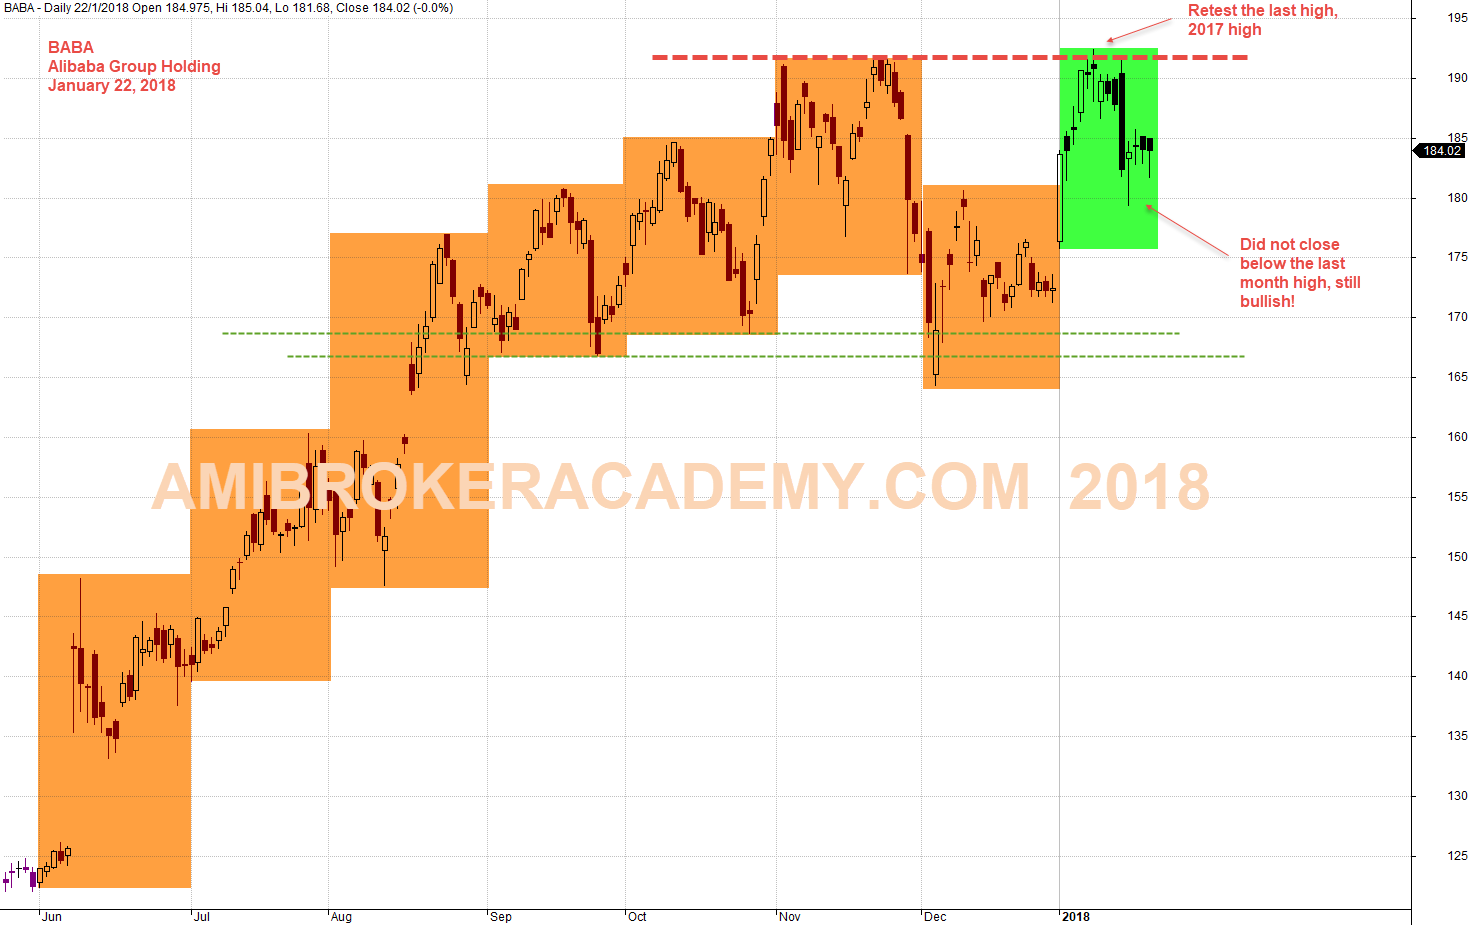
BABA Alibaba Group Holding and Month High Low
We study chart, and Alibaba stock price retest the high of 190. So, there was a triple top. See chart, the trend still bullish, as 2018 so far has not closed below the last month high. The worst, the price action may pullback to the strong level, see chart.
Picture worth a thousand words, see chart and think, think think (think more) and got more things. Have fun!
Manage your risk.
Powerful Chart Software – AmiBroker
The following chart is produced using AmiBroker charting software. It is a powerful chart software. You plot the stocks you are interested all in one chart, as long as you still could read them. See chart below.
January 22, 2018 Alibaba Group Holding and Month High Low
Moses
AmiBrokerAcademy.com
Disclaimer
The above result is for illustration purpose. It is not meant to be used for buy or sell decision. We do not recommend any particular stocks. If particular stocks of such are mentioned, they are meant as demonstration of Amibroker as a powerful charting software and MACD. Amibroker can program to scan the stocks for buy and sell signals.
These are script generated signals. Not all scan results are shown here. The MACD signal should use with price action. Users must understand what MACD and price action are all about before using them. If necessary you should attend a course to learn more on Technical Analysis (TA) and Moving Average Convergence Divergence, MACD.
Once again, the website does not guarantee any results or investment return based on the information and instruction you have read here. It should be used as learning aids only and if you decide to trade real money, all trading decision should be your own.