November 13, 2018
Thanks for visiting the site.
Shanghai Stock Analysis
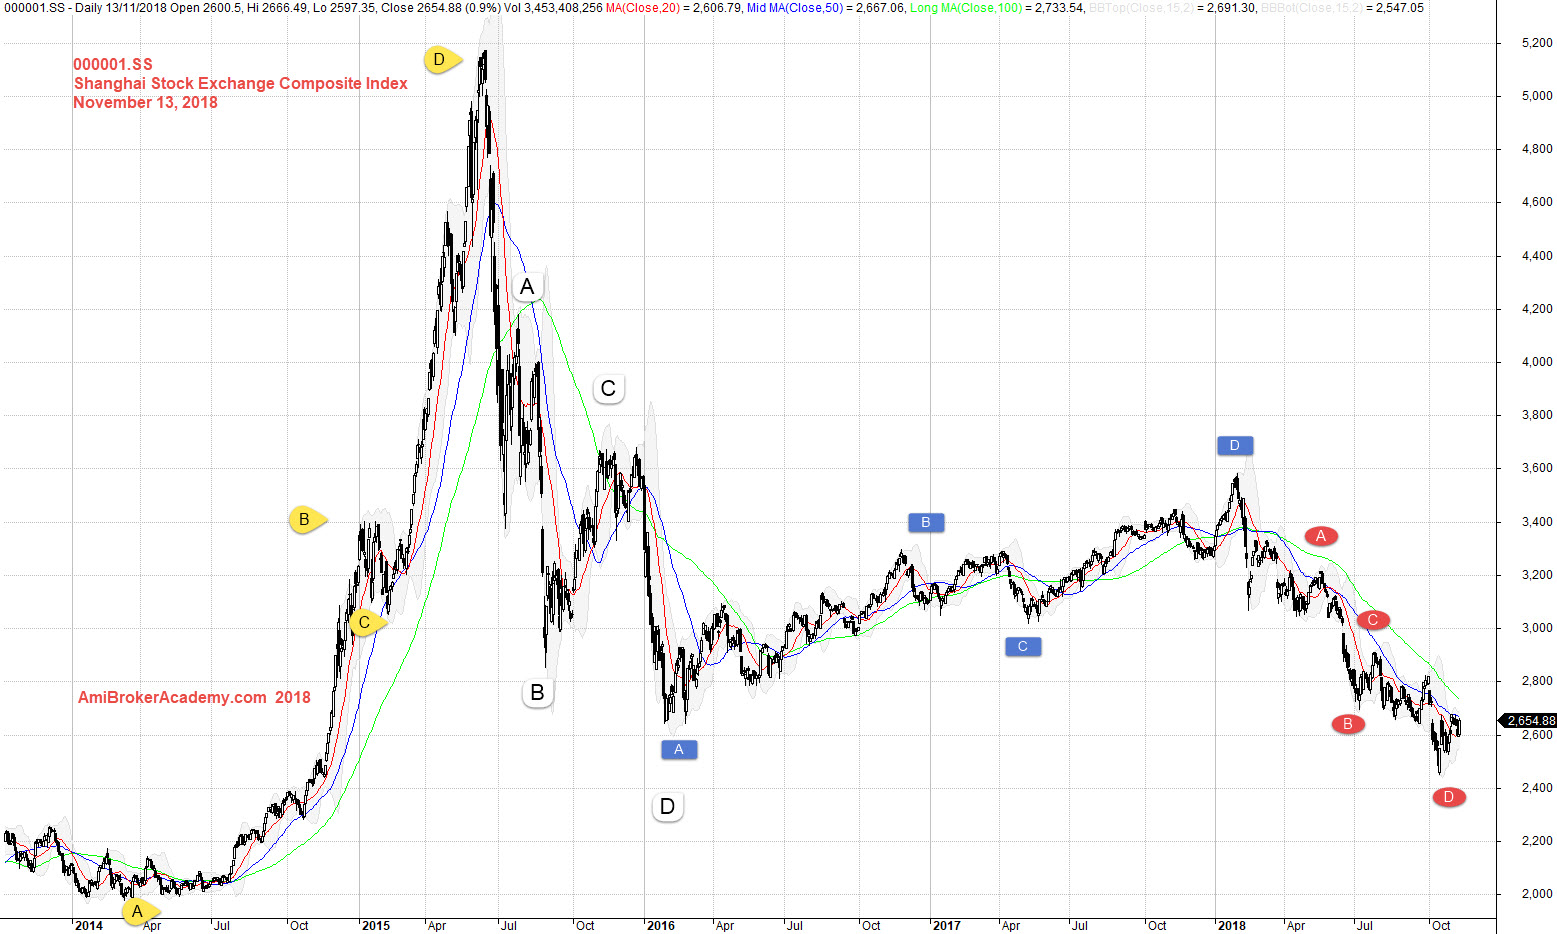
000001.SS 上海证交所指数 Shanghai Stock Exchange Composite Index Charting
See chart, the price action of 上海证交所指数 Shanghai Stock Exchange Composite Index Charting. The SSEC Index goes bull trend first before bear step in. The price action goes from the low in 2014 to the peak at 2015. And if you are H M Garley fan, you will sure see the Gartley 222 pattern. Now, you may apply the Gartley 222 pattern very different from H M Gartley himself. Read his book you will agree with me why you apply the Gartley 222 different from it original observation.
Trade with eyes open.
Manage your trade and risk.
November 13, 2018 Shanghai Stock Exchange Composite Index Charting
Moses
AmiBrokerAcademy.com
Disclaimer
The above result is for illustration purpose. It is not meant to be used for buy or sell decision. We do not recommend any particular stocks. If particular stocks of such are mentioned, they are meant as demonstration of Amibroker as a powerful charting software and MACD. Amibroker can program to scan the stocks for buy and sell signals.
These are script generated signals. Not all scan results are shown here. The MACD signal should use with price action. Users must understand what MACD and price action are all about before using them. If necessary you should attend a course to learn more on Technical Analysis (TA) and Moving Average Convergence Divergence, MACD.
Once again, the website does not guarantee any results or investment return based on the information and instruction you have read here. It should be used as learning aids only and if you decide to trade real money, all trading decision should be your own.